457 Clearstone Place Folsom, CA 95630
Estimated Value: $611,000 - $634,000
3
Beds
3
Baths
1,673
Sq Ft
$371/Sq Ft
Est. Value
About This Home
This home is located at 457 Clearstone Place, Folsom, CA 95630 and is currently estimated at $621,015, approximately $371 per square foot. 457 Clearstone Place is a home located in Sacramento County with nearby schools including Theodore Judah Elementary School, Sutter Middle School, and Folsom High School.
Ownership History
Date
Name
Owned For
Owner Type
Purchase Details
Closed on
Nov 2, 2006
Sold by
Pardieck Karen L
Bought by
Pardieck Karen L and The Karen L Pardieck Trust
Current Estimated Value
Purchase Details
Closed on
Jun 22, 2005
Sold by
Gottschall Eileen and The Bernardin Family Trust
Bought by
Pardieck Karen L
Home Financials for this Owner
Home Financials are based on the most recent Mortgage that was taken out on this home.
Original Mortgage
$359,650
Outstanding Balance
$185,579
Interest Rate
5.58%
Mortgage Type
Fannie Mae Freddie Mac
Estimated Equity
$435,436
Purchase Details
Closed on
May 11, 1999
Sold by
Bernardin Raymond A and Bernardin Irma M
Bought by
Bernardin Raymond A and Bernardin Irma M
Purchase Details
Closed on
Apr 21, 1999
Sold by
Diamond Glen Lp
Bought by
Bernardin Raymond A and Bernardin Irma M
Create a Home Valuation Report for This Property
The Home Valuation Report is an in-depth analysis detailing your home's value as well as a comparison with similar homes in the area
Home Values in the Area
Average Home Value in this Area
Purchase History
| Date | Buyer | Sale Price | Title Company |
|---|---|---|---|
| Pardieck Karen L | -- | None Available | |
| Pardieck Karen L | $450,000 | Placer Title Company | |
| Bernardin Raymond A | -- | Stewart Title | |
| Bernardin Raymond A | $179,000 | Stewart Title |
Source: Public Records
Mortgage History
| Date | Status | Borrower | Loan Amount |
|---|---|---|---|
| Open | Pardieck Karen L | $359,650 |
Source: Public Records
Tax History Compared to Growth
Tax History
| Year | Tax Paid | Tax Assessment Tax Assessment Total Assessment is a certain percentage of the fair market value that is determined by local assessors to be the total taxable value of land and additions on the property. | Land | Improvement |
|---|---|---|---|---|
| 2025 | $6,493 | $614,943 | $157,148 | $457,795 |
| 2024 | $6,493 | $602,886 | $154,067 | $448,819 |
| 2023 | $6,376 | $591,066 | $151,047 | $440,019 |
| 2022 | $6,282 | $579,478 | $148,086 | $431,392 |
| 2021 | $5,720 | $524,889 | $137,936 | $386,953 |
| 2020 | $5,019 | $462,458 | $121,530 | $340,928 |
| 2019 | $4,838 | $444,672 | $116,856 | $327,816 |
| 2018 | $4,624 | $427,570 | $112,362 | $315,208 |
| 2017 | $4,106 | $399,599 | $105,012 | $294,587 |
| 2016 | $4,551 | $415,263 | $106,121 | $309,142 |
| 2015 | $4,168 | $388,097 | $99,179 | $288,918 |
| 2014 | $3,955 | $380,487 | $97,234 | $283,253 |
Source: Public Records
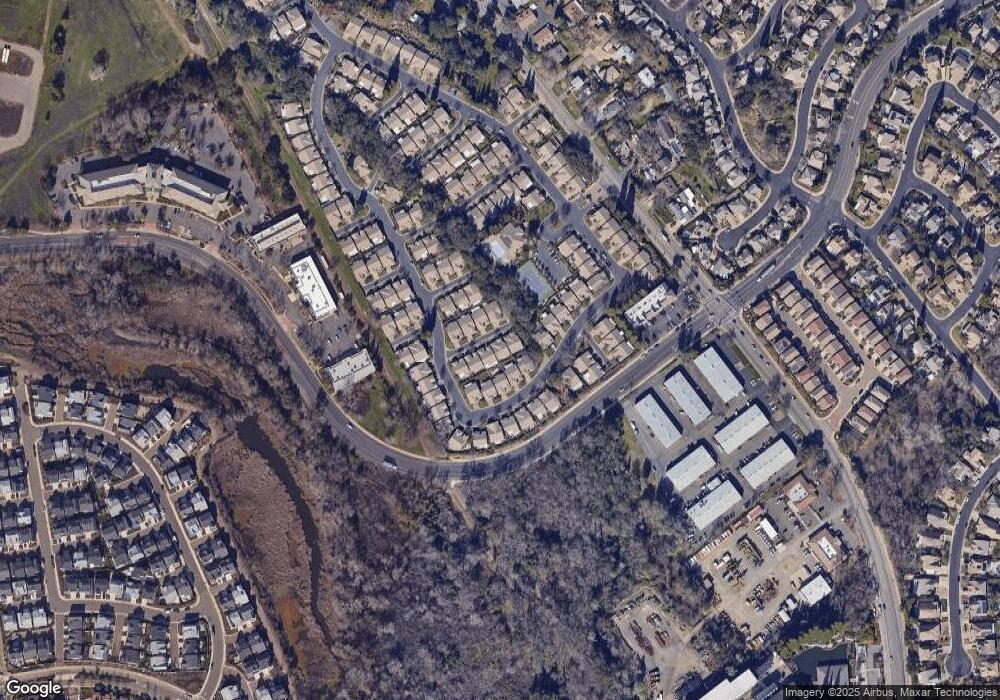
Map
Nearby Homes
- 467 Jewel Stone Way
- 932 Farmhouse Way
- 683 Loomis Cir
- 106 McNamee Dr
- 110 Lembi Dr
- 692 Humbert St
- 45 Diggins Dr
- 718 Hunter Place
- 661 Fisher Cir
- 709- Persifer St
- 105 Donegan Ct
- 145 Hopfield Dr
- 900 Figueroa St Unit B
- 901 Coloma St
- 1703 Ferry Cir
- 603 Figueroa St
- 98 Demurrage Way
- 5601 Spindrift Ln
- 9709 Snowberry Way
- 182 Price Way
- 459 Clearstone Place
- 455 Clearstone Place
- 453 Clearstone Place
- 681 Diamond Glen Cir
- 683 Diamond Glen Cir
- 679 Diamond Glen Cir
- 454 Clearstone Place
- 456 Clearstone Place
- 452 Clearstone Place
- 677 Diamond Glen Cir
- 687 Diamond Glen Cir
- 451 Clearstone Place
- 450 Clearstone Place
- 675 Diamond Glen Cir
- 689 Diamond Glen Cir
- 455 Baguette Place
- 453 Baguette Place
- 691 Diamond Glen Cir
- 682 Diamond Glen Cir
- 680 Diamond Glen Cir