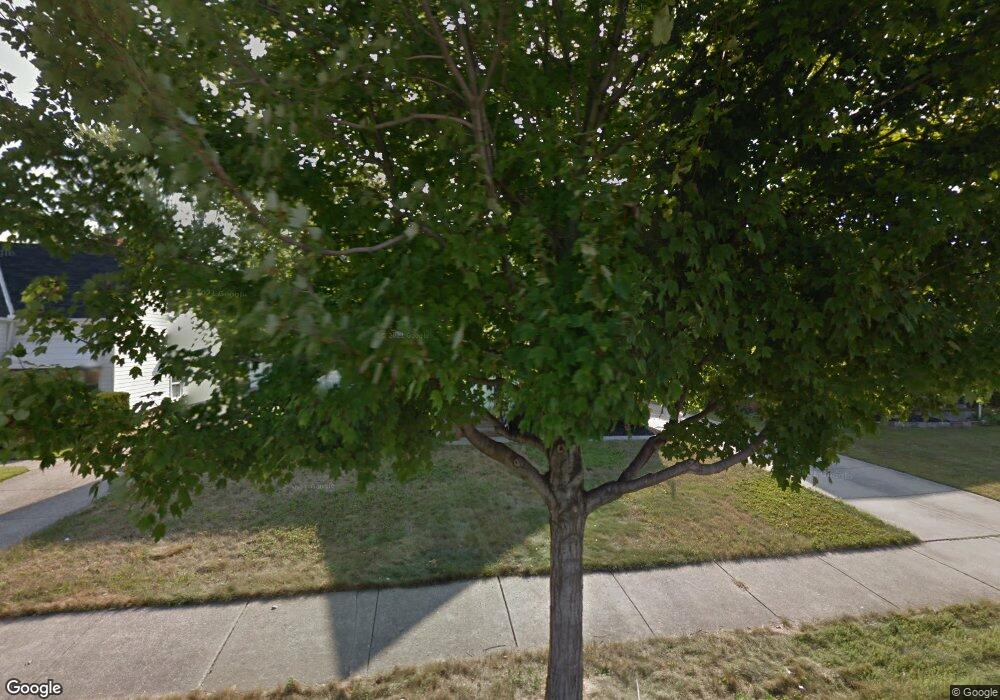
457 E 271st St Euclid, OH 44132
Estimated Value: $146,692 - $184,000
3
Beds
2
Baths
1,326
Sq Ft
$128/Sq Ft
Est. Value
About This Home
This home is located at 457 E 271st St, Euclid, OH 44132 and is currently estimated at $170,173, approximately $128 per square foot. 457 E 271st St is a home located in Cuyahoga County with nearby schools including Shoreview Elementary School, Euclid High School, and Mater Dei Academy.
Ownership History
Date
Name
Owned For
Owner Type
Purchase Details
Closed on
Jun 5, 2002
Sold by
Kowalski David M and Kowalski Kelley L
Bought by
Tedrick Ryan C and Rohr Peggy J
Current Estimated Value
Home Financials for this Owner
Home Financials are based on the most recent Mortgage that was taken out on this home.
Original Mortgage
$112,238
Outstanding Balance
$45,093
Interest Rate
6.95%
Mortgage Type
FHA
Estimated Equity
$125,080
Purchase Details
Closed on
May 8, 1997
Sold by
Est Frank P Malek Sr
Bought by
Kowalski Kelley L and Kowalski David M
Home Financials for this Owner
Home Financials are based on the most recent Mortgage that was taken out on this home.
Original Mortgage
$67,100
Interest Rate
8.05%
Mortgage Type
New Conventional
Purchase Details
Closed on
Jun 14, 1984
Sold by
Belhorn Paul C
Bought by
Malek Frank Paul
Purchase Details
Closed on
Jan 1, 1975
Bought by
Belhorn Paul C
Create a Home Valuation Report for This Property
The Home Valuation Report is an in-depth analysis detailing your home's value as well as a comparison with similar homes in the area
Home Values in the Area
Average Home Value in this Area
Purchase History
| Date | Buyer | Sale Price | Title Company |
|---|---|---|---|
| Tedrick Ryan C | $114,000 | -- | |
| Kowalski Kelley L | $83,900 | -- | |
| Malek Frank Paul | $59,000 | -- | |
| Belhorn Paul C | -- | -- |
Source: Public Records
Mortgage History
| Date | Status | Borrower | Loan Amount |
|---|---|---|---|
| Open | Tedrick Ryan C | $112,238 | |
| Closed | Kowalski Kelley L | $67,100 |
Source: Public Records
Tax History
| Year | Tax Paid | Tax Assessment Tax Assessment Total Assessment is a certain percentage of the fair market value that is determined by local assessors to be the total taxable value of land and additions on the property. | Land | Improvement |
|---|---|---|---|---|
| 2025 | $3,332 | $50,120 | $9,450 | $40,670 |
| 2024 | $3,440 | $50,120 | $9,450 | $40,670 |
| 2023 | $3,050 | $35,350 | $7,140 | $28,210 |
| 2022 | $2,981 | $35,350 | $7,140 | $28,210 |
| 2021 | $3,321 | $35,350 | $7,140 | $28,210 |
| 2020 | $3,151 | $30,490 | $6,160 | $24,330 |
| 2019 | $2,834 | $87,100 | $17,600 | $69,500 |
| 2018 | $2,835 | $30,490 | $6,160 | $24,330 |
| 2017 | $3,046 | $27,130 | $5,110 | $22,020 |
| 2016 | $3,052 | $27,130 | $5,110 | $22,020 |
| 2015 | $2,778 | $27,130 | $5,110 | $22,020 |
| 2014 | $2,778 | $27,130 | $5,110 | $22,020 |
Source: Public Records
Map
Nearby Homes
- 440 E 271st St
- 411 E 270th St
- 26931 Shoreview Ave
- 591 Hemlock Dr
- 26831 Shoreview Ave
- 597 Hemlock Dr
- 27190 Zeman Ave
- 406 E 274th St
- 427 E 275th St
- 610 E 266th St
- 26530 Shoreview Ave
- 325 E 264th St
- 625 Lloyd Rd
- 670 Hemlock Dr
- 298 E 270th St
- 26171 Shoreview Ave
- 730 Hemlock Dr
- 257 E 270th St
- 218 Wells Ct
- 355 E 257th St
- 451 E 271st St
- 459 E 271st St
- 445 E 271st St
- 470 E 272nd St
- 470 E 272nd St Unit E
- 468 E 272nd St
- 441 E 271st St
- 466 E 272nd St
- 27185 Forestview Ave
- 27175 Forestview Ave
- 464 E 272nd St
- 27195 Forestview Ave
- 27197 Forestview Ave
- 27199 Forestview Ave
- 456 E 271st St
- 435 E 271st St
- 450 E 271st St
- 460 E 271st St
- 27201 Forestview Ave
- 444 E 271st St
Your Personal Tour Guide
Ask me questions while you tour the home.