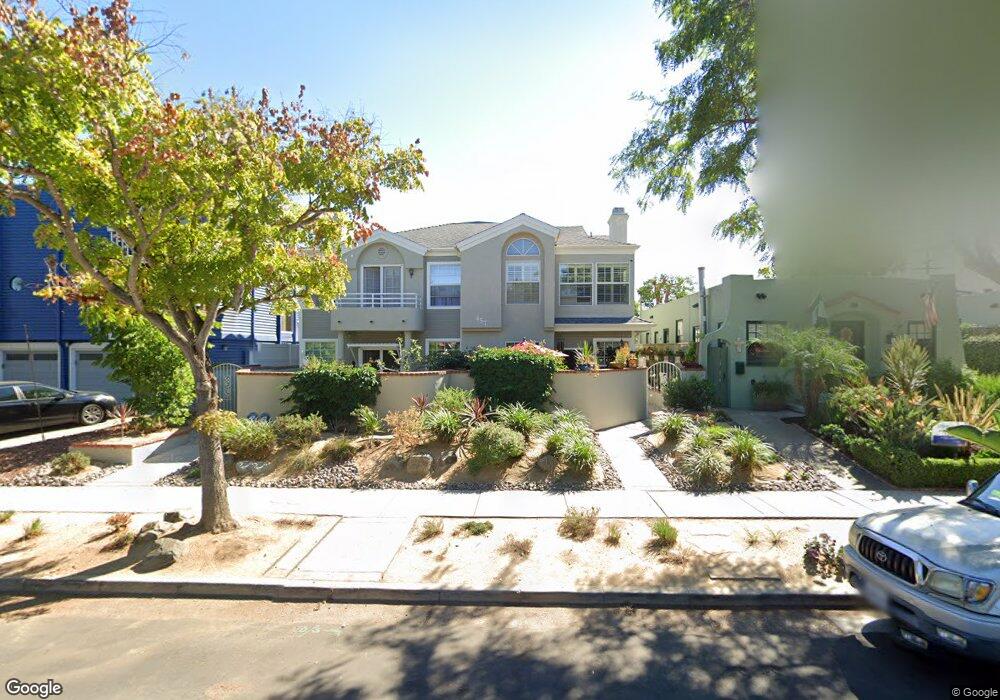
457 G Ave Unit B Coronado, CA 92118
Estimated Value: $1,496,000 - $1,817,000
3
Beds
3
Baths
1,704
Sq Ft
$960/Sq Ft
Est. Value
About This Home
This home is located at 457 G Ave Unit B, Coronado, CA 92118 and is currently estimated at $1,635,310, approximately $959 per square foot. 457 G Ave Unit B is a home located in San Diego County with nearby schools including Coronado Village Elementary, Coronado Middle School, and Coronado High School.
Ownership History
Date
Name
Owned For
Owner Type
Purchase Details
Closed on
Mar 6, 2001
Sold by
Hollaender Eylon
Bought by
Hollaender Eylon
Current Estimated Value
Purchase Details
Closed on
Feb 11, 2000
Sold by
Eylon Hollaender
Bought by
Hollaender Eylon
Purchase Details
Closed on
Mar 13, 1997
Sold by
Chapple Michael W and Chapple Mary Ann
Bought by
Hollaender Eylon and Hollaender Ursula
Home Financials for this Owner
Home Financials are based on the most recent Mortgage that was taken out on this home.
Original Mortgage
$230,000
Outstanding Balance
$26,684
Interest Rate
7.25%
Estimated Equity
$1,608,626
Purchase Details
Closed on
Nov 23, 1996
Sold by
Holian Francis K and Holian Carol L
Bought by
Chapple Michael W and Chapple Mary Ann
Home Financials for this Owner
Home Financials are based on the most recent Mortgage that was taken out on this home.
Original Mortgage
$211,500
Interest Rate
7.66%
Purchase Details
Closed on
Mar 22, 1990
Create a Home Valuation Report for This Property
The Home Valuation Report is an in-depth analysis detailing your home's value as well as a comparison with similar homes in the area
Home Values in the Area
Average Home Value in this Area
Purchase History
| Date | Buyer | Sale Price | Title Company |
|---|---|---|---|
| Hollaender Eylon | -- | -- | |
| Hollaender Eylon | -- | -- | |
| Hollaender Eylon | $330,000 | Gateway Title Company | |
| Chapple Michael W | $282,000 | Gateway Title Company | |
| -- | $320,900 | -- |
Source: Public Records
Mortgage History
| Date | Status | Borrower | Loan Amount |
|---|---|---|---|
| Open | Hollaender Eylon | $230,000 | |
| Previous Owner | Chapple Michael W | $211,500 |
Source: Public Records
Tax History
| Year | Tax Paid | Tax Assessment Tax Assessment Total Assessment is a certain percentage of the fair market value that is determined by local assessors to be the total taxable value of land and additions on the property. | Land | Improvement |
|---|---|---|---|---|
| 2025 | $5,977 | $537,445 | $236,149 | $301,296 |
| 2024 | $5,977 | $526,908 | $231,519 | $295,389 |
| 2023 | $5,885 | $516,578 | $226,980 | $289,598 |
| 2022 | $5,779 | $506,450 | $222,530 | $283,920 |
| 2021 | $5,697 | $496,520 | $218,167 | $278,353 |
| 2020 | $5,546 | $491,429 | $215,930 | $275,499 |
| 2019 | $5,527 | $481,795 | $211,697 | $270,098 |
| 2018 | $5,437 | $472,349 | $207,547 | $264,802 |
| 2017 | $20 | $463,088 | $203,478 | $259,610 |
| 2016 | $5,144 | $454,009 | $199,489 | $254,520 |
| 2015 | $5,045 | $447,190 | $196,493 | $250,697 |
| 2014 | $4,904 | $438,431 | $192,644 | $245,787 |
Source: Public Records
Map
Nearby Homes
Your Personal Tour Guide
Ask me questions while you tour the home.