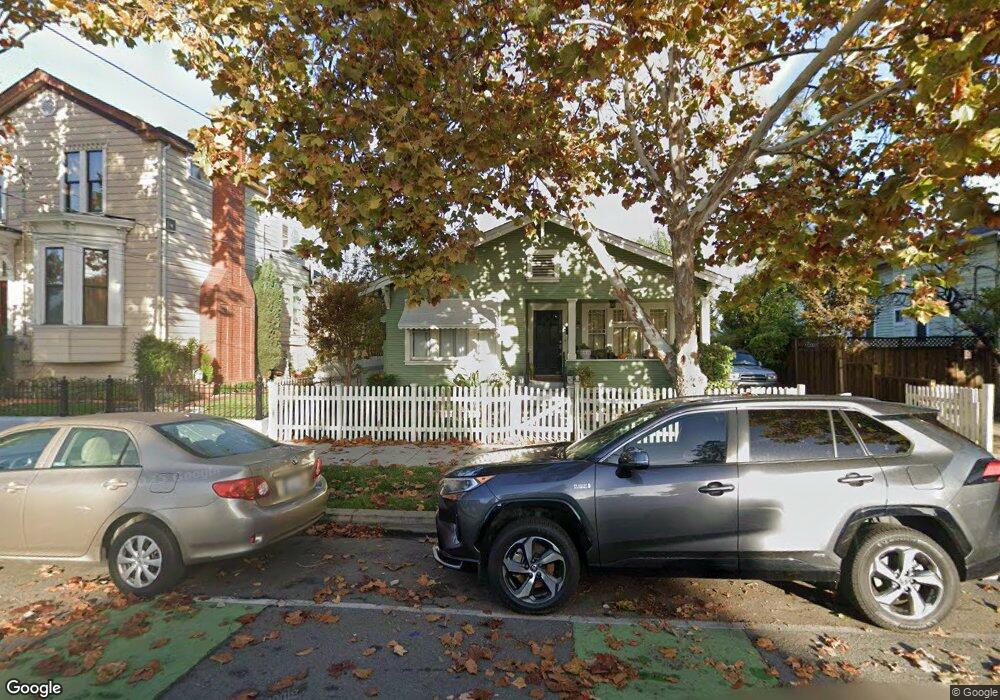
457 Jackson St San Jose, CA 95112
Japantown NeighborhoodEstimated Value: $962,000 - $1,065,000
2
Beds
1
Bath
1,040
Sq Ft
$970/Sq Ft
Est. Value
About This Home
This home is located at 457 Jackson St, San Jose, CA 95112 and is currently estimated at $1,008,944, approximately $970 per square foot. 457 Jackson St is a home located in Santa Clara County with nearby schools including Grant Elementary School, Muwekma Ohlone Middle, and San Jose High School.
Ownership History
Date
Name
Owned For
Owner Type
Purchase Details
Closed on
Oct 2, 2018
Sold by
Flores Gloria C and The Juan Manuel And Gloria Flo
Bought by
Demattos Monica and Demattos Jweffrey
Current Estimated Value
Purchase Details
Closed on
Sep 14, 2010
Sold by
Flores Gloria C
Bought by
Flores Gloria C
Purchase Details
Closed on
Dec 29, 2009
Sold by
Flores Gloria C
Bought by
Demattos Monica and Demattos Jeffrey
Purchase Details
Closed on
Sep 18, 2008
Sold by
Flores Juan Manuel and Flores Gloria C
Bought by
Demattos Monica and Demattos Jeffrey
Purchase Details
Closed on
Mar 21, 2001
Sold by
Flores Juan Manuel and Flores Gloria C
Bought by
Demattos Monica and Demattos Jeffrey
Create a Home Valuation Report for This Property
The Home Valuation Report is an in-depth analysis detailing your home's value as well as a comparison with similar homes in the area
Home Values in the Area
Average Home Value in this Area
Purchase History
| Date | Buyer | Sale Price | Title Company |
|---|---|---|---|
| Demattos Monica | -- | None Available | |
| Flores Gloria C | -- | None Available | |
| Demattos Monica | $24,000 | None Available | |
| Demattos Monica | -- | None Available | |
| Demattos Monica | -- | -- |
Source: Public Records
Tax History
| Year | Tax Paid | Tax Assessment Tax Assessment Total Assessment is a certain percentage of the fair market value that is determined by local assessors to be the total taxable value of land and additions on the property. | Land | Improvement |
|---|---|---|---|---|
| 2025 | $3,076 | $131,817 | $95,076 | $36,741 |
| 2024 | $3,076 | $129,233 | $93,212 | $36,021 |
| 2023 | $2,974 | $126,700 | $91,385 | $35,315 |
| 2022 | $2,935 | $124,217 | $89,594 | $34,623 |
| 2021 | $2,815 | $121,783 | $87,838 | $33,945 |
| 2020 | $2,705 | $120,535 | $86,938 | $33,597 |
| 2019 | $2,619 | $118,173 | $85,234 | $32,939 |
| 2018 | $2,649 | $115,857 | $83,563 | $32,294 |
| 2017 | $2,614 | $113,586 | $81,925 | $31,661 |
| 2016 | $2,420 | $111,360 | $80,319 | $31,041 |
| 2015 | $2,389 | $109,688 | $79,113 | $30,575 |
| 2014 | $1,974 | $107,541 | $77,564 | $29,977 |
Source: Public Records
Map
Nearby Homes
Your Personal Tour Guide
Ask me questions while you tour the home.