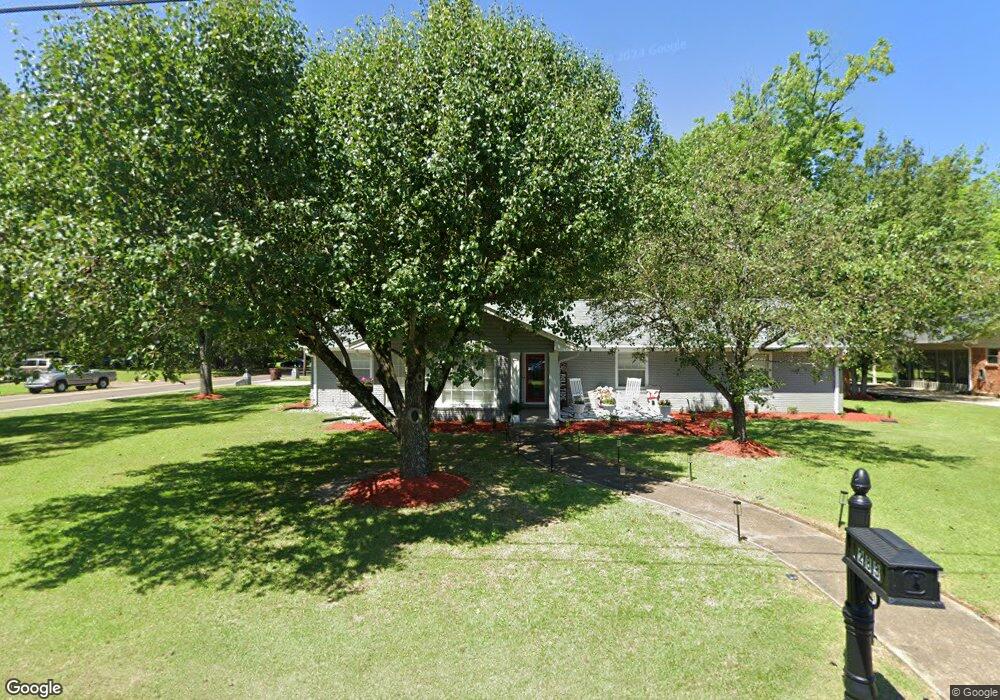
457 Mccord St West Point, MS 39773
Estimated Value: $212,000 - $302,000
3
Beds
--
Bath
3,133
Sq Ft
$77/Sq Ft
Est. Value
About This Home
This home is located at 457 Mccord St, West Point, MS 39773 and is currently estimated at $242,492, approximately $77 per square foot. 457 Mccord St is a home located in Clay County with nearby schools including East Side Elementary School, West Clay Elementary School, and Church Hill Elementary School.
Ownership History
Date
Name
Owned For
Owner Type
Purchase Details
Closed on
Nov 2, 2020
Sold by
Parker Jackie L
Bought by
Bradshaw Damion Tremain
Current Estimated Value
Home Financials for this Owner
Home Financials are based on the most recent Mortgage that was taken out on this home.
Original Mortgage
$149,737
Interest Rate
2.8%
Mortgage Type
FHA
Purchase Details
Closed on
Dec 28, 2010
Sold by
Portera Ethel H and Portera Joe C
Bought by
Parker Jackie L
Home Financials for this Owner
Home Financials are based on the most recent Mortgage that was taken out on this home.
Original Mortgage
$140,932
Interest Rate
4.4%
Create a Home Valuation Report for This Property
The Home Valuation Report is an in-depth analysis detailing your home's value as well as a comparison with similar homes in the area
Home Values in the Area
Average Home Value in this Area
Purchase History
| Date | Buyer | Sale Price | Title Company |
|---|---|---|---|
| Bradshaw Damion Tremain | -- | -- | |
| Bradshaw Damion Tremain | -- | -- | |
| Parker Jackie L | -- | -- |
Source: Public Records
Mortgage History
| Date | Status | Borrower | Loan Amount |
|---|---|---|---|
| Previous Owner | Bradshaw Damion Tremain | $149,737 | |
| Previous Owner | Parker Jackie L | $140,932 | |
| Previous Owner | Parker Jackie L | $140,932 |
Source: Public Records
Tax History Compared to Growth
Tax History
| Year | Tax Paid | Tax Assessment Tax Assessment Total Assessment is a certain percentage of the fair market value that is determined by local assessors to be the total taxable value of land and additions on the property. | Land | Improvement |
|---|---|---|---|---|
| 2024 | $899 | $19,335 | $2,412 | $16,923 |
| 2023 | $1,910 | $14,768 | $2,412 | $12,356 |
| 2022 | $655 | $14,768 | $2,412 | $12,356 |
| 2021 | $653 | $14,768 | $2,412 | $12,356 |
| 2020 | $653 | $14,768 | $2,412 | $12,356 |
| 2019 | $607 | $14,656 | $2,412 | $12,244 |
| 2018 | $576 | $14,656 | $2,412 | $12,244 |
| 2017 | $576 | $14,656 | $2,412 | $12,244 |
| 2016 | $548 | $14,656 | $2,412 | $12,244 |
| 2015 | $543 | $14,061 | $2,412 | $11,649 |
| 2014 | $286 | $14,061 | $2,412 | $11,649 |
| 2013 | $286 | $14,061 | $2,412 | $11,649 |
Source: Public Records
Map
Nearby Homes
- 472 S Eshman Ave
- 1180 E Broad St
- 551 E Westbrook St
- 1046 E Brame Ave
- 44 Torbert Dr
- 1153 E Broad St
- 485 E Westbrook St
- 1104 E Broad St
- 480 E Westbrook St
- 479 E Westbrook St
- 278 Converse Dr
- 329 Converse Dr
- 26596 E Main St
- 27045 E Main St
- 238 Calhoun St
- 27445 E Main St
- 15 David St
- 1124 N Eshman Ave
- 26852 E Main St
- 26788 E Main St