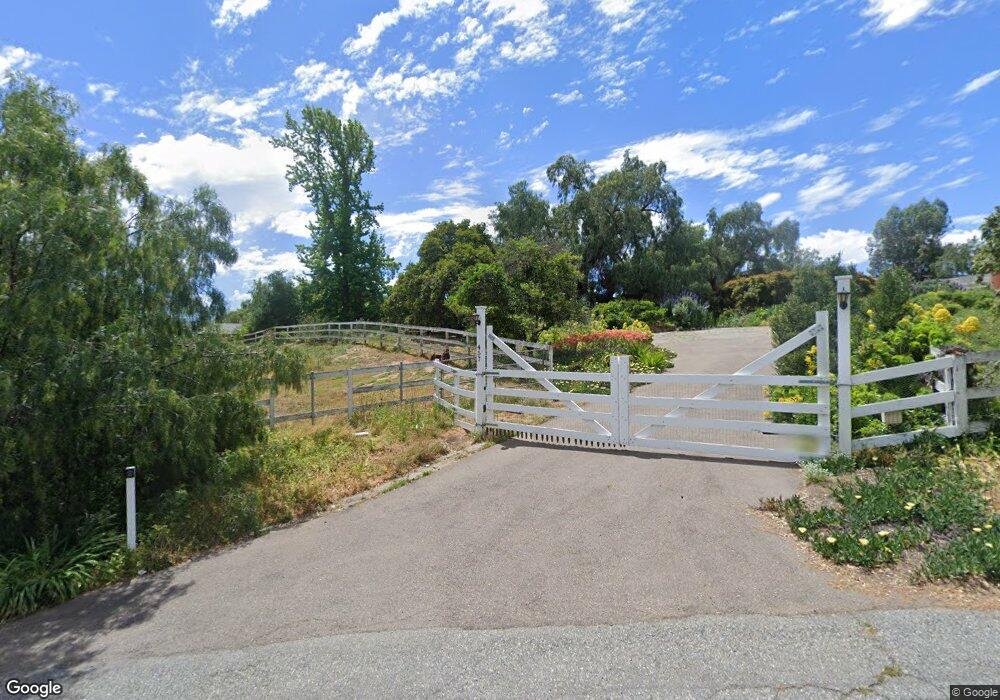
457 Olive Hill Way Fallbrook, CA 92028
Estimated Value: $1,062,000 - $1,323,000
4
Beds
4
Baths
2,754
Sq Ft
$417/Sq Ft
Est. Value
About This Home
This home is located at 457 Olive Hill Way, Fallbrook, CA 92028 and is currently estimated at $1,149,546, approximately $417 per square foot. 457 Olive Hill Way is a home located in San Diego County with nearby schools including Fallbrook STEM Academy, James E. Potter Intermediate School, and Fallbrook High School.
Ownership History
Date
Name
Owned For
Owner Type
Purchase Details
Closed on
Jun 27, 2014
Sold by
Hudgins Richard D
Bought by
Hudgins Richard D and Schary Lori S
Current Estimated Value
Home Financials for this Owner
Home Financials are based on the most recent Mortgage that was taken out on this home.
Original Mortgage
$353,700
Outstanding Balance
$268,705
Interest Rate
4.09%
Mortgage Type
New Conventional
Estimated Equity
$880,841
Purchase Details
Closed on
May 3, 2013
Sold by
Inman Toni N
Bought by
Hudgins Richard D
Purchase Details
Closed on
Jan 22, 2013
Sold by
Inman Toni M
Bought by
Inman Toni M
Purchase Details
Closed on
Jun 18, 2005
Sold by
Hudgins Richard D and Inman Toni M
Bought by
Hudgins Richard D and Inman Toni M
Home Financials for this Owner
Home Financials are based on the most recent Mortgage that was taken out on this home.
Original Mortgage
$375,000
Interest Rate
5.28%
Mortgage Type
Negative Amortization
Purchase Details
Closed on
Jul 28, 1986
Create a Home Valuation Report for This Property
The Home Valuation Report is an in-depth analysis detailing your home's value as well as a comparison with similar homes in the area
Home Values in the Area
Average Home Value in this Area
Purchase History
| Date | Buyer | Sale Price | Title Company |
|---|---|---|---|
| Hudgins Richard D | -- | Equity Title Company | |
| Hudgins Richard D | -- | Equity Title | |
| Inman Toni M | -- | None Available | |
| Hudgins Richard D | -- | Chicago Title Company | |
| -- | $200,000 | -- |
Source: Public Records
Mortgage History
| Date | Status | Borrower | Loan Amount |
|---|---|---|---|
| Open | Hudgins Richard D | $353,700 | |
| Closed | Hudgins Richard D | $375,000 |
Source: Public Records
Tax History Compared to Growth
Tax History
| Year | Tax Paid | Tax Assessment Tax Assessment Total Assessment is a certain percentage of the fair market value that is determined by local assessors to be the total taxable value of land and additions on the property. | Land | Improvement |
|---|---|---|---|---|
| 2025 | $4,058 | $390,442 | $107,360 | $283,082 |
| 2024 | $4,058 | $382,787 | $105,255 | $277,532 |
| 2023 | $3,949 | $375,283 | $103,192 | $272,091 |
| 2022 | $3,949 | $367,925 | $101,169 | $266,756 |
| 2021 | $3,816 | $360,712 | $99,186 | $261,526 |
| 2020 | $3,845 | $357,014 | $98,169 | $258,845 |
| 2019 | $3,768 | $350,015 | $96,245 | $253,770 |
| 2018 | $3,710 | $343,153 | $94,358 | $248,795 |
| 2017 | $3,635 | $336,425 | $92,508 | $243,917 |
| 2016 | $3,543 | $329,830 | $90,695 | $239,135 |
| 2015 | $3,487 | $324,876 | $89,333 | $235,543 |
| 2014 | $3,420 | $318,514 | $87,584 | $230,930 |
Source: Public Records
Map
Nearby Homes
- Vacant lot 65 Olive Hill Rd
- 3270 Olive Hill Rd
- 205 White Horse Ln
- 2240 Aqua Hill Rd
- 1139 Big Oak Ranch Rd
- 1106 Big Oak Ranch Rd
- 3044 Camino Cielo
- 706 W Winterhaven Rd
- 3048 Jason Rd
- 504 Burma Rd
- 2715 S Mission Rd
- 1326 Sunset Grove Rd
- 1335 El Nido Dr
- 3860 Las Flores Dr
- 2330 Morro Rd
- 2830 Green Canyon Rd
- 3912 Cirro Vista Way
- 2175 Kirkcaldy Rd
- 1650 Winterwarm Dr
- 3915 Palomar Dr
- 0 Olive Hill Way Unit T11089725
- 0 Olive Hill Way Unit 110039445
- 405 Olive Hill Way
- 0000 Olive Hill Way
- 3325 Olive Hill Rd
- 464 Olive Hill Way
- 442 Olive Hill Way
- 480 Olive Hill Way
- 3000 Olive Hill Rd
- 408 Olive Hill Way
- 401 Olive Hill Way
- 3203 Olive Hill Rd
- 3363 Olive Hill Rd
- 3335 Olive Hill Rd
- Vacant lot Olive Hill Rd
- 3351 Olive Hill Rd
- 2481 Arabian Trail
- 2516 Aqua Hill Rd
- 3165 Olive Hill Rd
- 3157 Olive Hill Rd