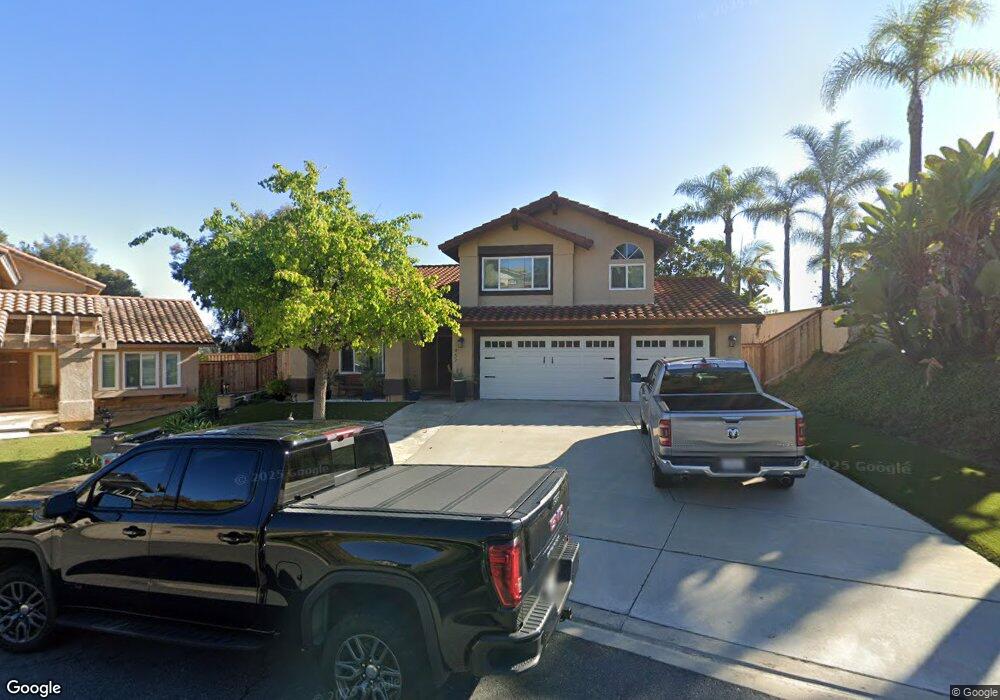
457 Via Savoy Encinitas, CA 92024
Central Encinitas NeighborhoodEstimated Value: $1,967,000 - $2,286,000
5
Beds
3
Baths
2,336
Sq Ft
$894/Sq Ft
Est. Value
About This Home
This home is located at 457 Via Savoy, Encinitas, CA 92024 and is currently estimated at $2,088,118, approximately $893 per square foot. 457 Via Savoy is a home located in San Diego County with nearby schools including Park Dale Lane Elementary, Oak Crest Middle School, and La Costa Canyon High School.
Ownership History
Date
Name
Owned For
Owner Type
Purchase Details
Closed on
May 1, 2017
Sold by
Oseguera David
Bought by
Oseguera David and The David Oseguera Family Trust
Current Estimated Value
Purchase Details
Closed on
Sep 15, 2008
Sold by
Gonzales Rebecca P and Oseguera Rebecca P G
Bought by
Oseguera David
Home Financials for this Owner
Home Financials are based on the most recent Mortgage that was taken out on this home.
Original Mortgage
$205,000
Interest Rate
5.12%
Mortgage Type
New Conventional
Purchase Details
Closed on
Apr 10, 1986
Bought by
Oseguera David Rebecca P G
Create a Home Valuation Report for This Property
The Home Valuation Report is an in-depth analysis detailing your home's value as well as a comparison with similar homes in the area
Home Values in the Area
Average Home Value in this Area
Purchase History
| Date | Buyer | Sale Price | Title Company |
|---|---|---|---|
| Oseguera David | -- | None Available | |
| Oseguera David | -- | Lawyers Title | |
| Oseguera David Rebecca P G | $187,900 | -- |
Source: Public Records
Mortgage History
| Date | Status | Borrower | Loan Amount |
|---|---|---|---|
| Previous Owner | Oseguera David | $205,000 |
Source: Public Records
Tax History
| Year | Tax Paid | Tax Assessment Tax Assessment Total Assessment is a certain percentage of the fair market value that is determined by local assessors to be the total taxable value of land and additions on the property. | Land | Improvement |
|---|---|---|---|---|
| 2025 | $4,521 | $1,676,708 | $1,273,449 | $403,259 |
| 2024 | $4,521 | $366,804 | $98,103 | $268,701 |
| 2023 | $4,296 | $359,613 | $96,180 | $263,433 |
| 2022 | $4,177 | $352,563 | $94,295 | $258,268 |
| 2021 | $4,090 | $345,651 | $92,447 | $253,204 |
| 2020 | $4,010 | $342,108 | $91,500 | $250,608 |
| 2019 | $3,933 | $335,401 | $89,706 | $245,695 |
| 2018 | $3,874 | $328,826 | $87,948 | $240,878 |
| 2017 | $3,810 | $322,379 | $86,224 | $236,155 |
| 2016 | $3,698 | $316,059 | $84,534 | $231,525 |
| 2015 | $3,619 | $311,313 | $83,265 | $228,048 |
| 2014 | $3,524 | $305,215 | $81,634 | $223,581 |
Source: Public Records
Map
Nearby Homes
- 350 N El Camino Real Unit 78s
- 350 N El Camino Real Unit 72
- 444 N El Camino Real Unit 47
- 444 N El Camino Real Unit 48
- 444 N El Camino Real Unit SPC 42
- 444 N El Camino Real Unit 119
- 444 N El Camino Real Unit 23
- 444 N El Camino Real Unit 110
- 1502 Vanessa Cir
- 598 Paloma Ct
- 155 Rosebay Dr Unit 42
- 1693 Honeysuckle Ct
- 800 Encinitas Blvd Unit 104
- 731 Teaberry St Unit 4
- 1517 Shields Ave
- 935 Encinitas Blvd
- 1642 Blossom Field Way
- 2072 Wandering Rd
- 1733 Gentle Breeze Ln
- 2063 Wandering Rd
- 469 Via Savoy
- 445 Via Savoy
- 492 Via Malaga
- 472 Via Savoy
- 433 Via Savoy
- 421 Via Savoy
- 495 Via Malaga
- 451 Via Montalvo
- 483 Via Malaga
- 409 Via Savoy
- 439 Via Montalvo
- 471 Via Malaga
- 427 Via Montalvo
- 415 Via Montalvo
- 459 Via Malaga
- 463 Via Montalvo
- 447 Via Malaga
- 466 Via Montalvo
- 435 Via Malaga
- 1235 Via Montoro
Your Personal Tour Guide
Ask me questions while you tour the home.