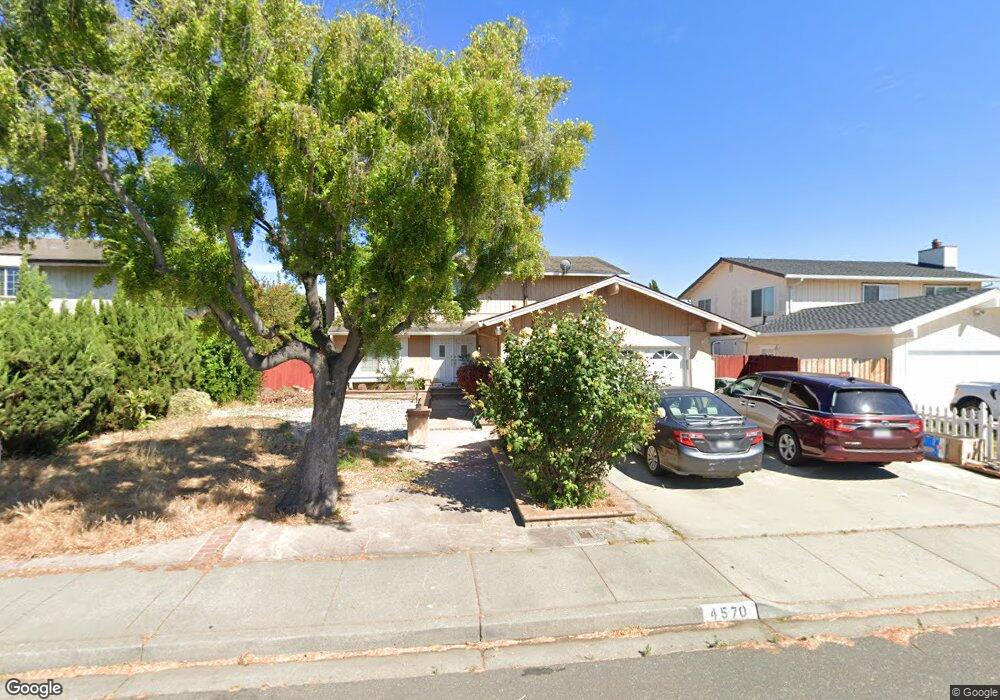
4570 Ellen Way Union City, CA 94587
Alvarado NeighborhoodEstimated Value: $1,325,000 - $1,673,780
5
Beds
3
Baths
2,054
Sq Ft
$748/Sq Ft
Est. Value
About This Home
This home is located at 4570 Ellen Way, Union City, CA 94587 and is currently estimated at $1,537,195, approximately $748 per square foot. 4570 Ellen Way is a home located in Alameda County with nearby schools including Pioneer Elementary School, Itliong-Vera Cruz, and James Logan High School.
Ownership History
Date
Name
Owned For
Owner Type
Purchase Details
Closed on
Apr 30, 2019
Sold by
Cruz Reynaldo A and Cruz Teresita B
Bought by
Zou Changjian and Liu Yan
Current Estimated Value
Home Financials for this Owner
Home Financials are based on the most recent Mortgage that was taken out on this home.
Original Mortgage
$808,456
Outstanding Balance
$696,483
Interest Rate
3.25%
Mortgage Type
Adjustable Rate Mortgage/ARM
Estimated Equity
$840,712
Purchase Details
Closed on
Apr 28, 2004
Sold by
Cruz Reynaldo and Cruz Teresita
Bought by
Cruz Reynaldo A and Cruz Teresita B
Home Financials for this Owner
Home Financials are based on the most recent Mortgage that was taken out on this home.
Original Mortgage
$425,000
Interest Rate
6.99%
Mortgage Type
New Conventional
Purchase Details
Closed on
Jun 16, 1964
Sold by
Cruz Reynaldo
Bought by
Mid Ohio Securities Corp
Create a Home Valuation Report for This Property
The Home Valuation Report is an in-depth analysis detailing your home's value as well as a comparison with similar homes in the area
Home Values in the Area
Average Home Value in this Area
Purchase History
| Date | Buyer | Sale Price | Title Company |
|---|---|---|---|
| Zou Changjian | $1,011,000 | First American Title Company | |
| Cruz Reynaldo A | -- | -- | |
| Mid Ohio Securities Corp | $5,000 | -- | |
| Mid Ohio Securities Corp | $4,500 | -- |
Source: Public Records
Mortgage History
| Date | Status | Borrower | Loan Amount |
|---|---|---|---|
| Open | Zou Changjian | $808,456 | |
| Previous Owner | Cruz Reynaldo A | $425,000 |
Source: Public Records
Tax History Compared to Growth
Tax History
| Year | Tax Paid | Tax Assessment Tax Assessment Total Assessment is a certain percentage of the fair market value that is determined by local assessors to be the total taxable value of land and additions on the property. | Land | Improvement |
|---|---|---|---|---|
| 2025 | $15,275 | $1,127,211 | $338,163 | $789,048 |
| 2024 | $15,275 | $1,105,112 | $331,533 | $773,579 |
| 2023 | $14,839 | $1,083,447 | $325,034 | $758,413 |
| 2022 | $14,611 | $1,062,207 | $318,662 | $743,545 |
| 2021 | $14,288 | $1,041,380 | $312,414 | $728,966 |
| 2020 | $13,963 | $1,030,710 | $309,213 | $721,497 |
| 2019 | $4,254 | $226,587 | $33,616 | $192,971 |
| 2018 | $4,151 | $222,145 | $32,957 | $189,188 |
| 2017 | $4,051 | $217,790 | $32,311 | $185,479 |
| 2016 | $3,908 | $213,520 | $31,678 | $181,842 |
| 2015 | $3,827 | $210,314 | $31,202 | $179,112 |
| 2014 | $3,684 | $206,195 | $30,591 | $175,604 |
Source: Public Records
Map
Nearby Homes
- 4639 Michelle Ct
- 32451 Regents Blvd
- 4532 Delores Dr
- 32409 Elizabeth Way
- 32461 Darlene Way
- 4501 Alice Way
- 4210 Comet Cir
- 4231 Hanford St
- 34102 Zaner Way
- 4214 Saturn Way
- 4243 Comet Cir
- 4511 Martin St
- 32447 Pacific Grove Way
- 32945 Regents Blvd
- 32425 Pacific Grove Way
- 4852 Nadine Ct
- 32606 Singh Cir
- 4263 Queen Anne Dr
- 4633 Granada Way
- 4167 Sunflower Ct
- 4566 Ellen Way
- 4574 Ellen Way
- 4569 Laura Way
- 4565 Laura Way
- 4573 Laura Way
- 4562 Ellen Way
- 4578 Ellen Way
- 32477 Edith Way
- 4561 Laura Way
- 4577 Laura Way
- 4558 Ellen Way
- 4561 Ellen Way
- 4582 Ellen Way
- 4557 Laura Way
- 4581 Laura Way
- 32475 Edith Way
- 4555 Ellen Way
- 32472 Edith Way
- 4554 Ellen Way
- 4553 Laura Way