45700 Bowery Ln Unit 2,3 Temecula, CA 92590
De Luz NeighborhoodEstimated Value: $442,000
Studio
--
Bath
--
Sq Ft
174,240
Sq Ft Lot
About This Home
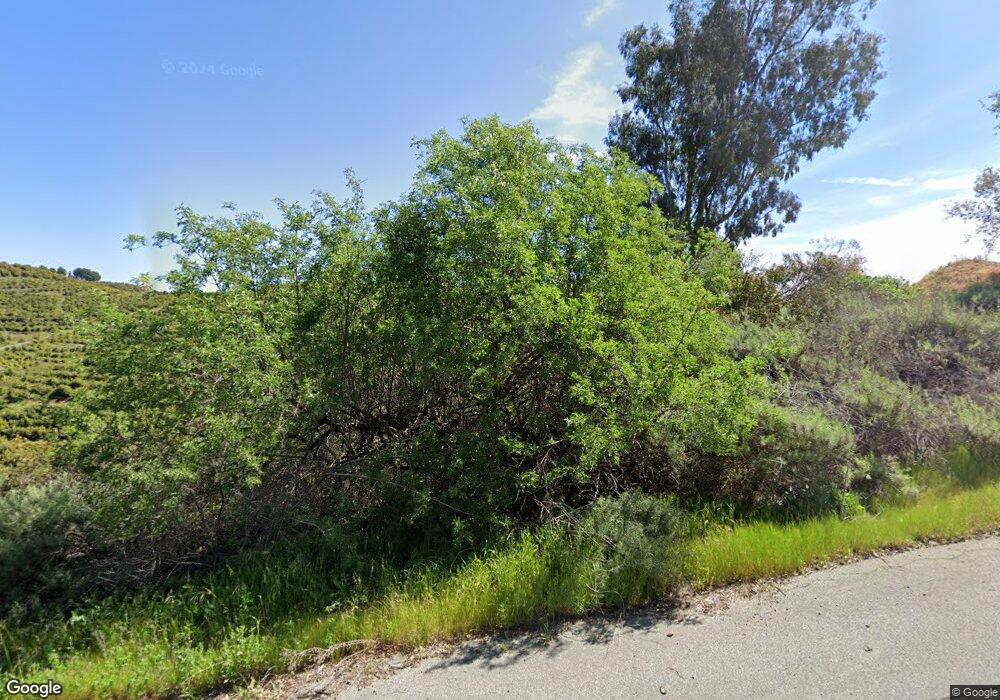
This home is located at 45700 Bowery Ln Unit 2,3, Temecula, CA 92590 and is currently estimated at $442,000. 45700 Bowery Ln Unit 2,3 is a home located in Riverside County with nearby schools including Murrieta Elementary School, Thompson Middle School, and Murrieta Valley High School.
Ownership History
Date
Name
Owned For
Owner Type
Purchase Details
Closed on
Apr 18, 2022
Sold by
Maryam Sami
Bought by
Sami Behrooz
Current Estimated Value
Purchase Details
Closed on
Mar 9, 2022
Sold by
George Papanastasatos
Bought by
Sami Behrooz
Purchase Details
Closed on
Oct 17, 2019
Sold by
Williams Morley and Williams Carolyn K
Bought by
Papanastasatos George and Kinkladze Mariam A
Home Financials for this Owner
Home Financials are based on the most recent Mortgage that was taken out on this home.
Original Mortgage
$219,000
Interest Rate
3.65%
Mortgage Type
Seller Take Back
Purchase Details
Closed on
Mar 2, 2018
Sold by
Williams Morley and Williams Carolyn
Bought by
Williams Morley and Williams Carolyn K
Purchase Details
Closed on
Nov 16, 2015
Sold by
The Spiker Family Revocable Living Trust
Bought by
Williams Morley and Williams Carolyn
Create a Home Valuation Report for This Property
The Home Valuation Report is an in-depth analysis detailing your home's value as well as a comparison with similar homes in the area
Home Values in the Area
Average Home Value in this Area
Purchase History
| Date | Buyer | Sale Price | Title Company |
|---|---|---|---|
| Sami Behrooz | -- | Ticor Title | |
| Sami Behrooz | $450,000 | Ticor Title | |
| Papanastasatos George | $249,000 | Ticor Title Insurance Co | |
| Williams Morley | -- | None Available | |
| Williams Morley | $227,500 | Chicago Title Company |
Source: Public Records
Mortgage History
| Date | Status | Borrower | Loan Amount |
|---|---|---|---|
| Previous Owner | Papanastasatos George | $219,000 |
Source: Public Records
Tax History
| Year | Tax Paid | Tax Assessment Tax Assessment Total Assessment is a certain percentage of the fair market value that is determined by local assessors to be the total taxable value of land and additions on the property. | Land | Improvement |
|---|---|---|---|---|
| 2025 | $8,369 | $477,541 | $457,487 | $20,054 |
| 2023 | $8,369 | $458,999 | $439,723 | $19,276 |
| 2022 | $5,096 | $256,607 | $237,136 | $19,471 |
| 2021 | $8,540 | $251,577 | $232,487 | $19,090 |
| 2020 | $4,974 | $249,000 | $230,104 | $18,896 |
| 2019 | $4,849 | $241,423 | $222,323 | $19,100 |
| 2018 | $4,773 | $236,690 | $217,963 | $18,727 |
| 2017 | $4,714 | $232,050 | $213,690 | $18,360 |
| 2016 | $4,657 | $227,500 | $209,500 | $18,000 |
| 2015 | $2,824 | $110,617 | $110,617 | $0 |
| 2014 | $2,752 | $108,451 | $108,451 | $0 |
Source: Public Records
Map
Nearby Homes
- 6 El Prado
- 0 Serreno Rd
- 5 De Anza Rd
- 23192 De Anza Rd
- 11 Sandia Creek Dr
- 16 Sandia Creek Dr
- 44888 Sandia Creek Dr
- 45200 Camaron Rd
- 9 La Cruz
- 8 La Cruz Dr
- 17 La Casita Dr
- 0 La Villa Cir Unit SW25197616
- 16 Camaron Rd
- 45711 Camaron Rd
- 15 Camaron Rd
- 25900 Carancho Rd
- 23476 La Vella Rd
- 0 Masako Cir Unit PW25130514
- 22103 Carancho Rd
- 45811 Camaron Rd
- 45700 Bowery Ln
- 45700 Bowery Ln Unit 147
- 46180 El Prado Rd
- 10 Carrillo Rd
- 11 Carrillo Rd
- 0 Bowery Ln Unit SW12143475
- 0 Bowery Ln Unit SW14096801
- 0 Bowery Ln Unit SW15081563
- 0 Bowery Ln Unit 150043679
- 45700 El Prado Rd
- 24155 Via Mirola
- 45650 Bowery Ln
- 45670 El Prado Rd
- 24165 Via Mirola
- 45550 El Prado Rd
- 47099 Via Mejor
- 46291 El Prado Rd
- 46341 El Prado Rd
- 24153 Via Mirola
- 46337 El Prado Rd
Your Personal Tour Guide
Ask me questions while you tour the home.