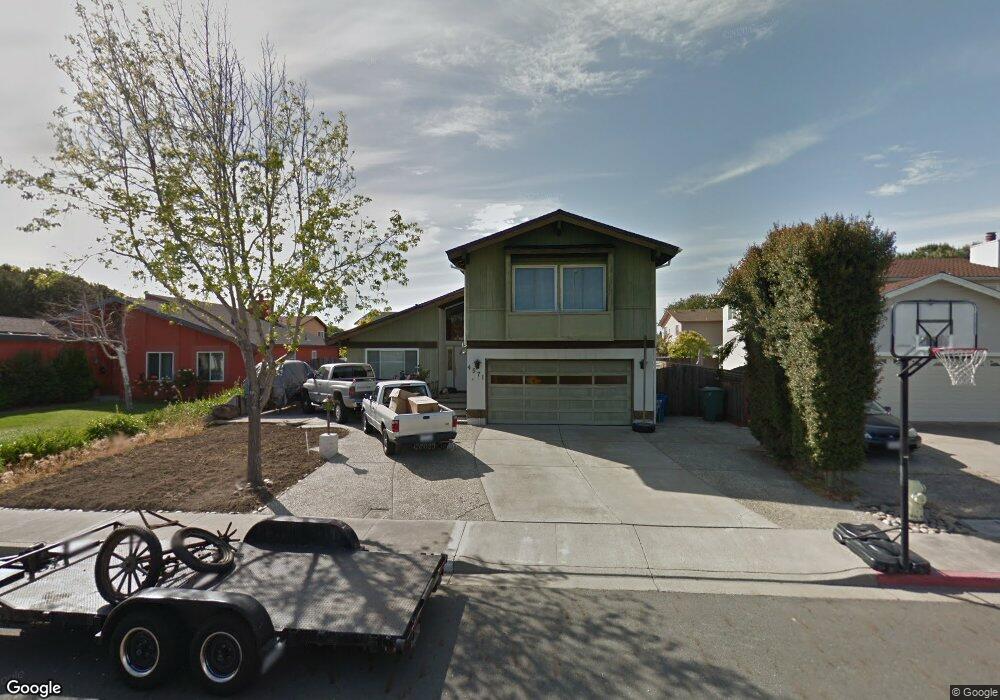
4571 Carmen Way Union City, CA 94587
Alvarado NeighborhoodEstimated Value: $1,502,000 - $1,704,544
4
Beds
3
Baths
2,031
Sq Ft
$781/Sq Ft
Est. Value
About This Home
This home is located at 4571 Carmen Way, Union City, CA 94587 and is currently estimated at $1,587,136, approximately $781 per square foot. 4571 Carmen Way is a home located in Alameda County with nearby schools including Pioneer Elementary School, Itliong-Vera Cruz, and James Logan High School.
Ownership History
Date
Name
Owned For
Owner Type
Purchase Details
Closed on
Jun 30, 2023
Sold by
Sarkar Sritama and Sarkar Paul Abhishek
Bought by
Sarkar-Paul Family Trust and Sarkar
Current Estimated Value
Purchase Details
Closed on
Jul 24, 2017
Sold by
Dgl Realty Inc
Bought by
Paul Abhishek and Sarkar Sritama
Home Financials for this Owner
Home Financials are based on the most recent Mortgage that was taken out on this home.
Original Mortgage
$799,000
Interest Rate
3.5%
Mortgage Type
Adjustable Rate Mortgage/ARM
Purchase Details
Closed on
Mar 24, 2017
Sold by
Torres Manuel M and Torres Kathryn E
Bought by
Dgl Reality Inc
Purchase Details
Closed on
Jun 24, 1998
Sold by
Torres L M and Torres T
Bought by
Torres Manuel M and Torres Kathryn E
Home Financials for this Owner
Home Financials are based on the most recent Mortgage that was taken out on this home.
Original Mortgage
$248,000
Interest Rate
7.17%
Mortgage Type
Stand Alone First
Create a Home Valuation Report for This Property
The Home Valuation Report is an in-depth analysis detailing your home's value as well as a comparison with similar homes in the area
Home Values in the Area
Average Home Value in this Area
Purchase History
| Date | Buyer | Sale Price | Title Company |
|---|---|---|---|
| Sarkar-Paul Family Trust | -- | None Listed On Document | |
| Paul Abhishek | $940,000 | Chicago Title Company | |
| Dgl Reality Inc | $755,000 | None Available | |
| Torres Manuel M | $124,000 | Financial Title Company |
Source: Public Records
Mortgage History
| Date | Status | Borrower | Loan Amount |
|---|---|---|---|
| Previous Owner | Paul Abhishek | $799,000 | |
| Previous Owner | Torres Manuel M | $248,000 |
Source: Public Records
Tax History Compared to Growth
Tax History
| Year | Tax Paid | Tax Assessment Tax Assessment Total Assessment is a certain percentage of the fair market value that is determined by local assessors to be the total taxable value of land and additions on the property. | Land | Improvement |
|---|---|---|---|---|
| 2025 | $14,489 | $1,062,540 | $320,862 | $748,678 |
| 2024 | $14,489 | $1,041,570 | $314,571 | $733,999 |
| 2023 | $14,070 | $1,028,011 | $308,403 | $719,608 |
| 2022 | $13,849 | $1,000,858 | $302,357 | $705,501 |
| 2021 | $13,541 | $981,098 | $296,429 | $691,669 |
| 2020 | $13,236 | $977,975 | $293,392 | $684,583 |
| 2019 | $13,378 | $958,800 | $287,640 | $671,160 |
| 2018 | $13,073 | $940,000 | $282,000 | $658,000 |
| 2017 | $2,704 | $110,073 | $31,226 | $78,847 |
| 2016 | $2,610 | $107,914 | $30,613 | $77,301 |
| 2015 | $2,552 | $106,293 | $30,153 | $76,140 |
| 2014 | $2,456 | $104,212 | $29,563 | $74,649 |
Source: Public Records
Map
Nearby Homes
- 4532 Delores Dr
- 4639 Michelle Ct
- 32451 Regents Blvd
- 32461 Darlene Way
- 32409 Elizabeth Way
- 4501 Alice Way
- 34102 Zaner Way
- 4231 Hanford St
- 4511 Martin St
- 4243 Comet Cir
- 4214 Saturn Way
- 32945 Regents Blvd
- 4852 Nadine Ct
- 32447 Pacific Grove Way
- 4100 Aquarius Cir
- 32425 Pacific Grove Way
- 32606 Singh Cir
- 32542 Lake Tana St
- 33025 Calistoga St
- 4263 Queen Anne Dr
- 4575 Carmen Way
- 4567 Carmen Way
- 4572 Laura Way
- 4576 Laura Way
- 4579 Carmen Way
- 4563 Carmen Way
- 4568 Laura Way
- 4580 Laura Way
- 4574 Carmen Way
- 4570 Carmen Way
- 4564 Laura Way
- 4578 Carmen Way
- 4559 Carmen Way
- 4583 Carmen Way
- 4584 Laura Way
- 4566 Carmen Way
- 4582 Carmen Way
- 4560 Laura Way
- 4562 Carmen Way
- 4555 Carmen Way