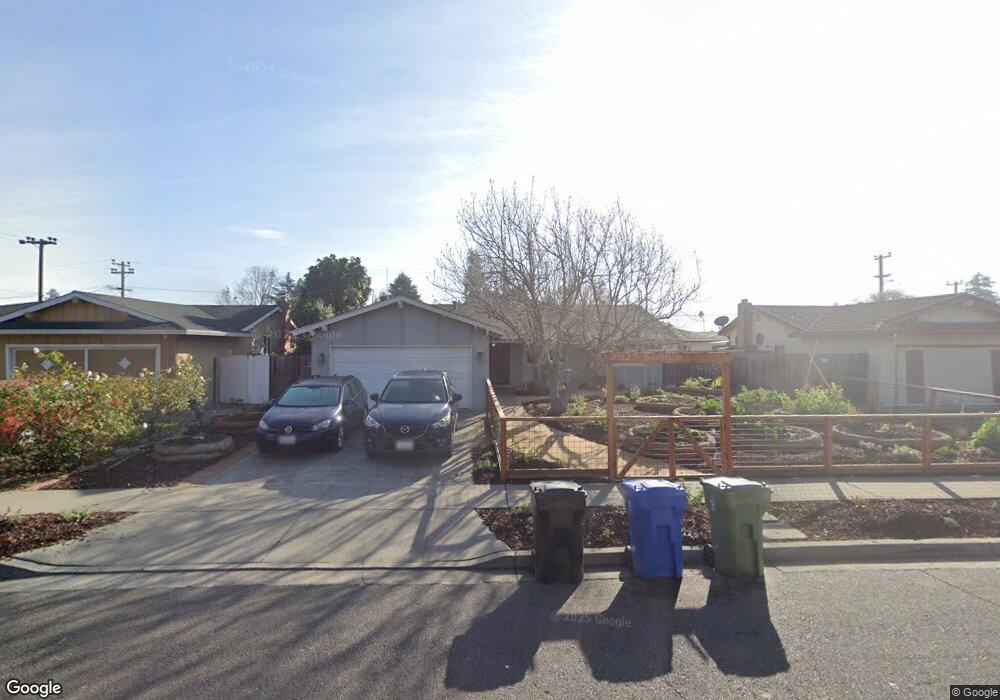
4572 Glenn St Fremont, CA 94536
Centerville District NeighborhoodEstimated Value: $1,400,382 - $1,566,000
3
Beds
2
Baths
1,347
Sq Ft
$1,082/Sq Ft
Est. Value
About This Home
This home is located at 4572 Glenn St, Fremont, CA 94536 and is currently estimated at $1,457,846, approximately $1,082 per square foot. 4572 Glenn St is a home located in Alameda County with nearby schools including Oliveira Elementary School, Thornton Middle School, and American High School.
Ownership History
Date
Name
Owned For
Owner Type
Purchase Details
Closed on
Jan 23, 2015
Sold by
Monroe Jo Cynthia and Monroe Anthony Stephen
Bought by
Monroe Jo Cynthia and Monroe Anthony Stephen
Current Estimated Value
Home Financials for this Owner
Home Financials are based on the most recent Mortgage that was taken out on this home.
Original Mortgage
$396,000
Outstanding Balance
$221,581
Interest Rate
3.75%
Mortgage Type
New Conventional
Estimated Equity
$1,236,265
Purchase Details
Closed on
Sep 9, 2004
Sold by
Solomon Greg A and Fites Melissa M
Bought by
Brown Jo Cynthia and Monroe Anthony Stephen
Home Financials for this Owner
Home Financials are based on the most recent Mortgage that was taken out on this home.
Original Mortgage
$333,700
Interest Rate
5.94%
Mortgage Type
Purchase Money Mortgage
Purchase Details
Closed on
Nov 12, 1998
Sold by
Asakawa Kimiyo
Bought by
Solomon Greg A and Fites Melissa M
Home Financials for this Owner
Home Financials are based on the most recent Mortgage that was taken out on this home.
Original Mortgage
$227,150
Interest Rate
6.42%
Create a Home Valuation Report for This Property
The Home Valuation Report is an in-depth analysis detailing your home's value as well as a comparison with similar homes in the area
Home Values in the Area
Average Home Value in this Area
Purchase History
| Date | Buyer | Sale Price | Title Company |
|---|---|---|---|
| Monroe Jo Cynthia | -- | None Available | |
| Brown Jo Cynthia | $535,000 | New Century Title Company | |
| Solomon Greg A | $242,000 | Fidelity National Title Co |
Source: Public Records
Mortgage History
| Date | Status | Borrower | Loan Amount |
|---|---|---|---|
| Open | Monroe Jo Cynthia | $396,000 | |
| Closed | Brown Jo Cynthia | $333,700 | |
| Previous Owner | Solomon Greg A | $227,150 | |
| Closed | Brown Jo Cynthia | $174,550 |
Source: Public Records
Tax History Compared to Growth
Tax History
| Year | Tax Paid | Tax Assessment Tax Assessment Total Assessment is a certain percentage of the fair market value that is determined by local assessors to be the total taxable value of land and additions on the property. | Land | Improvement |
|---|---|---|---|---|
| 2025 | $9,023 | $738,671 | $223,701 | $521,970 |
| 2024 | $9,023 | $724,055 | $219,316 | $511,739 |
| 2023 | $8,778 | $716,723 | $215,017 | $501,706 |
| 2022 | $8,660 | $695,674 | $210,802 | $491,872 |
| 2021 | $8,448 | $681,897 | $206,669 | $482,228 |
| 2020 | $8,458 | $681,835 | $204,550 | $477,285 |
| 2019 | $8,361 | $668,471 | $200,541 | $467,930 |
| 2018 | $8,197 | $655,368 | $196,610 | $458,758 |
| 2017 | $7,991 | $642,524 | $192,757 | $449,767 |
| 2016 | $7,853 | $629,930 | $188,979 | $440,951 |
| 2015 | $7,746 | $620,471 | $186,141 | $434,330 |
| 2014 | $7,124 | $567,000 | $170,100 | $396,900 |
Source: Public Records
Map
Nearby Homes
- 37001 Contra Costa Ave
- 4637 Rothbury Common
- 4632 Balboa Way
- 4737 Deadwood Dr
- 36521 Cabrillo Dr
- 37114 Dondero Way
- 36347 Magellan Dr
- Plan 1629 at Veranda
- Plan 1165 at Veranda
- Plan 1670 at Veranda
- Plan 1455 at Veranda
- Plan 1394 at Veranda
- Plan 1725 at Veranda
- Plan 1378 at Veranda
- Plan 1657 at Veranda
- 36686 Charles St
- 36720 Charles St
- 5113 Dupont Ave
- 37721 Madera Ct
- 36139 San Pedro Dr
- 4586 Glenn St
- 4558 Glenn St
- 37022 Shasta St
- 4522 Santa Cruz Ct
- 4544 Glenn St
- 4530 Santa Cruz Ct
- 4528 Thornton Ave Unit 19
- 37034 Shasta St
- 4530 Thornton Ave Unit 17
- 4532 Thornton Ave Unit 20
- 4534 Thornton Ave Unit 18
- 4534 Thornton Ave
- 4530 Glenn St
- 4526 Thornton Ave Unit 21
- 37003 Shasta St
- 4544 Thornton Ave
- 37015 Shasta St
- 4524 Thornton Ave Unit 22
- 4544 Santa Cruz Ct
- 4539 Glenn St Unit 13