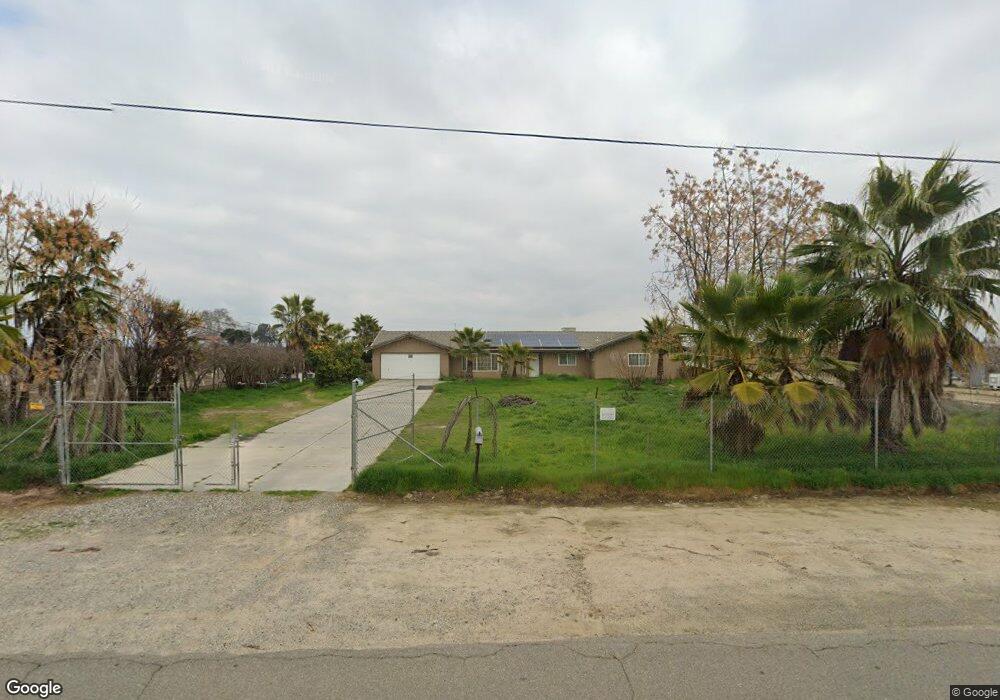
4574 S Greenwood Ave Unit 1 Sanger, CA 93657
Estimated Value: $1,361,000
4
Beds
3
Baths
2,170
Sq Ft
$627/Sq Ft
Est. Value
About This Home
This home is located at 4574 S Greenwood Ave Unit 1, Sanger, CA 93657 and is currently estimated at $1,361,000, approximately $627 per square foot. 4574 S Greenwood Ave Unit 1 is a home located in Fresno County with nearby schools including Del Rey Elementary School, Washington Academic Middle School, and Sanger High School.
Ownership History
Date
Name
Owned For
Owner Type
Purchase Details
Closed on
Oct 5, 2022
Sold by
Marsons Inc
Bought by
5Am Farming Llc
Current Estimated Value
Purchase Details
Closed on
Jun 16, 2022
Sold by
Natures Pick Llc
Bought by
Marsons Inc
Purchase Details
Closed on
Mar 5, 2018
Sold by
Vang Song and Yang Xong
Bought by
Natures Pick Llc
Home Financials for this Owner
Home Financials are based on the most recent Mortgage that was taken out on this home.
Original Mortgage
$415,000
Interest Rate
4.22%
Mortgage Type
Commercial
Purchase Details
Closed on
Dec 8, 2010
Sold by
Vang Nelson and Vang Chongge
Bought by
Vang Song and Yang Xong
Purchase Details
Closed on
Feb 12, 2009
Sold by
Amity Investment Company Llc
Bought by
Vang Nelson and Vang Chongge
Create a Home Valuation Report for This Property
The Home Valuation Report is an in-depth analysis detailing your home's value as well as a comparison with similar homes in the area
Home Values in the Area
Average Home Value in this Area
Purchase History
| Date | Buyer | Sale Price | Title Company |
|---|---|---|---|
| 5Am Farming Llc | -- | None Listed On Document | |
| Marsons Inc | $1,900,000 | Chicago Title | |
| Natures Pick Llc | $675,000 | Fidelity National Title Comp | |
| Vang Song | -- | Fidelity National Title Comp | |
| Vang Song | -- | None Available | |
| Vang Nelson | -- | Fidelity National Title Co |
Source: Public Records
Mortgage History
| Date | Status | Borrower | Loan Amount |
|---|---|---|---|
| Previous Owner | Natures Pick Llc | $415,000 |
Source: Public Records
Tax History Compared to Growth
Tax History
| Year | Tax Paid | Tax Assessment Tax Assessment Total Assessment is a certain percentage of the fair market value that is determined by local assessors to be the total taxable value of land and additions on the property. | Land | Improvement |
|---|---|---|---|---|
| 2025 | $13,547 | $1,085,907 | $745,770 | $340,137 |
| 2023 | $13,547 | $990,800 | $687,400 | $303,400 |
| 2022 | $10,146 | $722,598 | $463,190 | $259,408 |
| 2021 | $10,074 | $708,430 | $454,108 | $254,322 |
| 2020 | $9,814 | $701,167 | $449,452 | $251,715 |
| 2019 | $9,639 | $687,420 | $440,640 | $246,780 |
| 2018 | $5,493 | $415,585 | $264,605 | $150,980 |
| 2017 | $5,408 | $407,437 | $259,417 | $148,020 |
| 2016 | $5,112 | $399,449 | $254,331 | $145,118 |
| 2015 | $5,150 | $393,450 | $250,511 | $142,939 |
| 2014 | $4,433 | $376,244 | $245,604 | $130,640 |
Source: Public Records
Map
Nearby Homes
- 1665 S Bethel Ave
- 12251 E Jefferson Ave
- 3630 S Greenwood Ave
- Sydney Plan at Somerset
- Aspen Plan at Somerset
- Carmel Plan at Somerset
- Aspen with Loft Plan at Somerset
- Carlton Plan at Somerset
- Naples Plan at Somerset
- Lot 3 2165 Taunton Ave
- Lot 4 2155 Taunton Ave
- Lot 6 2135 Taunton Ave
- 2161 Heidi Ave
- 1837 Heidi Ave
- 2131 Heidi Ave Unit 15 S
- Coolidge Plan at Serenade
- 2115 Heidi Ave Unit 16 S
- 2087 Heidi Ave Unit 18 S
- Monroe Plan at Serenade
- 2131 Heidi Ave
- 4574 S Greenwood Ave
- 4500 S Greenwood Ave
- 4737 S Greenwood Ave
- 4417 S Greenwood Ave
- 4847 S Greenwood Ave
- 4847 S Greenwood Ave
- 4527 S Academy Ave
- 4276 S Greenwood Ave
- 12228 E American Ave
- 4259 S Greenwood Ave
- 12160 E American Ave
- 12670 E American Ave
- 12130 E American Ave
- 12287 E American Ave
- 5026 S Greenwood Ave
- 4857 S Academy Ave
- 12821 E American Ave
- 4753 S Bethel Ave
- 4736 S Bethel Ave
- 4776 S Bethel Ave