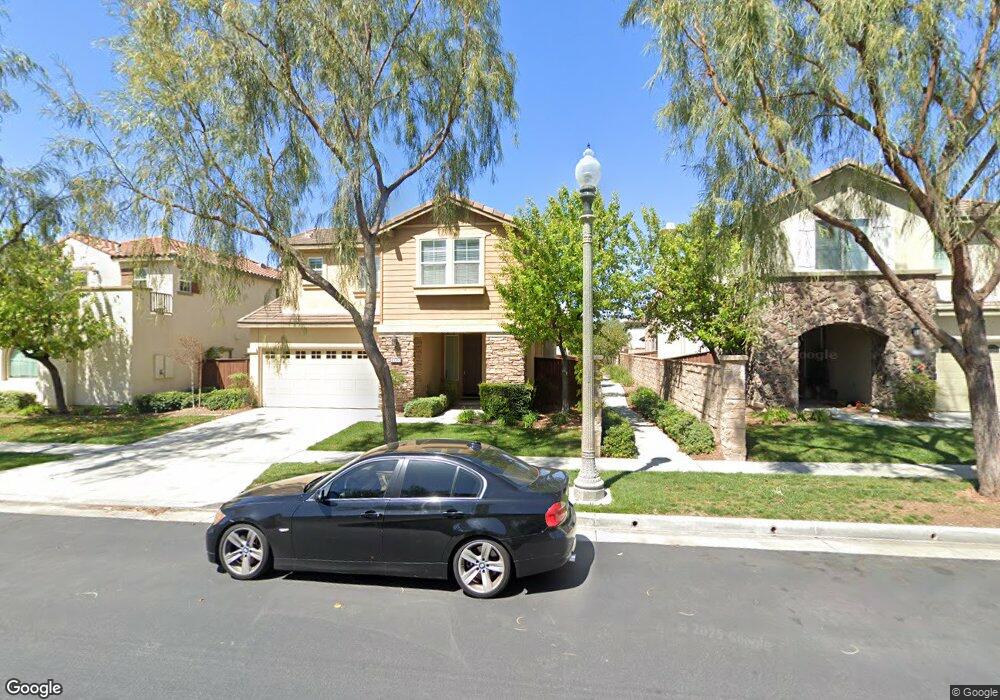
45773 Sierra Ct Temecula, CA 92592
Wolf Creek NeighborhoodEstimated Value: $678,000 - $688,995
3
Beds
3
Baths
2,274
Sq Ft
$301/Sq Ft
Est. Value
About This Home
This home is located at 45773 Sierra Ct, Temecula, CA 92592 and is currently estimated at $684,249, approximately $300 per square foot. 45773 Sierra Ct is a home located in Riverside County with nearby schools including Temecula Luiseno Elementary, Erle Stanley Gardner Middle School, and Great Oak High School.
Ownership History
Date
Name
Owned For
Owner Type
Purchase Details
Closed on
Apr 7, 2010
Sold by
J Kosta R Matthews Partnership
Bought by
Luke Jason R and Luke Melissa J
Current Estimated Value
Home Financials for this Owner
Home Financials are based on the most recent Mortgage that was taken out on this home.
Original Mortgage
$276,180
Interest Rate
5.05%
Mortgage Type
FHA
Purchase Details
Closed on
Feb 11, 2010
Sold by
Chu Jay El Cipriano
Bought by
J Kosta R Matthews Partnership
Home Financials for this Owner
Home Financials are based on the most recent Mortgage that was taken out on this home.
Original Mortgage
$276,180
Interest Rate
5.05%
Mortgage Type
FHA
Purchase Details
Closed on
Sep 6, 2006
Sold by
William Lyon Homes Inc
Bought by
Chu Jay El Cipriano
Home Financials for this Owner
Home Financials are based on the most recent Mortgage that was taken out on this home.
Original Mortgage
$352,080
Interest Rate
6.87%
Mortgage Type
Purchase Money Mortgage
Create a Home Valuation Report for This Property
The Home Valuation Report is an in-depth analysis detailing your home's value as well as a comparison with similar homes in the area
Home Values in the Area
Average Home Value in this Area
Purchase History
| Date | Buyer | Sale Price | Title Company |
|---|---|---|---|
| Luke Jason R | $280,000 | Stewart Title Of California | |
| J Kosta R Matthews Partnership | $235,000 | Fidelity Natl Title Ins Co | |
| Chu Jay El Cipriano | $440,500 | First American Title Company |
Source: Public Records
Mortgage History
| Date | Status | Borrower | Loan Amount |
|---|---|---|---|
| Previous Owner | Luke Jason R | $276,180 | |
| Previous Owner | Chu Jay El Cipriano | $352,080 |
Source: Public Records
Tax History
| Year | Tax Paid | Tax Assessment Tax Assessment Total Assessment is a certain percentage of the fair market value that is determined by local assessors to be the total taxable value of land and additions on the property. | Land | Improvement |
|---|---|---|---|---|
| 2025 | $6,206 | $361,282 | $77,437 | $283,845 |
| 2023 | $6,206 | $347,255 | $74,431 | $272,824 |
| 2022 | $6,112 | $340,447 | $72,972 | $267,475 |
| 2021 | $6,083 | $333,773 | $71,542 | $262,231 |
| 2020 | $6,032 | $330,352 | $70,809 | $259,543 |
| 2019 | $5,978 | $323,875 | $69,421 | $254,454 |
| 2018 | $5,902 | $317,525 | $68,061 | $249,464 |
| 2017 | $5,827 | $311,300 | $66,727 | $244,573 |
| 2016 | $5,753 | $305,197 | $65,419 | $239,778 |
| 2015 | $5,685 | $300,615 | $64,438 | $236,177 |
| 2014 | $5,569 | $294,728 | $63,177 | $231,551 |
Source: Public Records
Map
Nearby Homes
- 31579 Mendocino Ct
- 31348 Huron St
- 31218 Comotilo Ct
- 45590 Alpine Place
- 31155 Lahontan St
- 31109 Shicali Ct
- 45374 Zuma Dr
- 31007 Shaba Cir
- 31814 Murdock Ln
- 45511 Seagull Way
- 31352 Via Eduardo
- 45495 Peacock Place
- 45418 Seagull Way
- 45320 Esmerado Ct
- 31935 Bitterroot Ct
- 45303 Esmerado Ct
- 31937 Red Pine Way Unit 80
- 31868 Corte Montoya
- 31545 Via Cordoba
- 31889 Red Pine Way
- 45749 Sierra Ct
- 45765 Sierra Ct
- 45769 Sierra Ct
- 45742 Honeysuckle Ct
- 45757 Sierra Ct
- 45781 Sierra Ct
- 45754 Honeysuckle Ct
- 45745 Sierra Ct
- 45730 Honeysuckle Ct
- 45753 Sierra Ct
- 45789 Sierra Ct
- 45766 Honeysuckle Ct
- 45785 Sierra Ct
- 45741 Sierra Ct
- 45718 Honeysuckle Ct
- 45793 Sierra Ct
- 45733 Sierra Ct
- 45778 Honeysuckle Ct
- 45762 Sierra Ct
- 45766 Sierra Ct
Your Personal Tour Guide
Ask me questions while you tour the home.