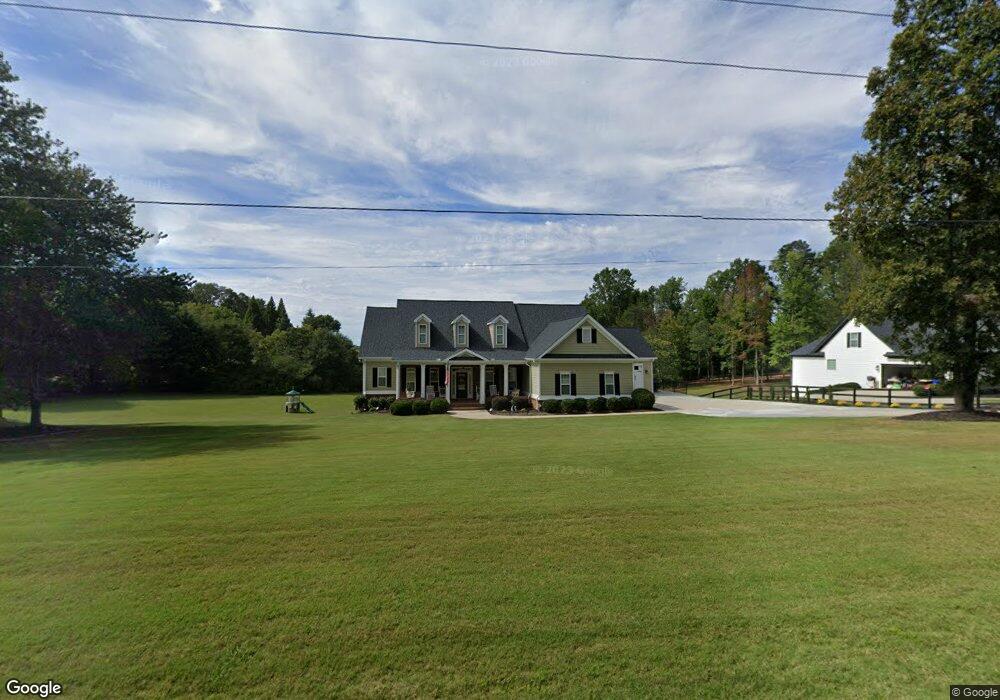
4579 Clarks Bridge Rd Gainesville, GA 30506
Estimated Value: $553,694 - $645,000
3
Beds
3
Baths
2,416
Sq Ft
$248/Sq Ft
Est. Value
About This Home
This home is located at 4579 Clarks Bridge Rd, Gainesville, GA 30506 and is currently estimated at $598,924, approximately $247 per square foot. 4579 Clarks Bridge Rd is a home located in Hall County with nearby schools including Wauka Mountain Elementary School, North Hall Middle School, and North Hall High School.
Ownership History
Date
Name
Owned For
Owner Type
Purchase Details
Closed on
Aug 21, 2025
Sold by
Cantrell Bruce
Bought by
Bruce & Teresa Cantrell Living Trust and Cantrell Bruce Tr
Current Estimated Value
Purchase Details
Closed on
Jul 2, 2007
Sold by
Applegate Developers Llc
Bought by
Cantrell Bruce and Cantrell Teresa Lynn
Home Financials for this Owner
Home Financials are based on the most recent Mortgage that was taken out on this home.
Original Mortgage
$240,000
Interest Rate
6.35%
Mortgage Type
New Conventional
Purchase Details
Closed on
Oct 31, 2006
Sold by
Adams Katherine L
Bought by
Applegate Developers Llc
Purchase Details
Closed on
Jun 19, 2006
Sold by
Arrowhead Developers Llc
Bought by
Applegate Developers Llc
Home Financials for this Owner
Home Financials are based on the most recent Mortgage that was taken out on this home.
Original Mortgage
$256,308
Interest Rate
6.51%
Create a Home Valuation Report for This Property
The Home Valuation Report is an in-depth analysis detailing your home's value as well as a comparison with similar homes in the area
Home Values in the Area
Average Home Value in this Area
Purchase History
| Date | Buyer | Sale Price | Title Company |
|---|---|---|---|
| Bruce & Teresa Cantrell Living Trust | -- | -- | |
| Cantrell Bruce | $300,000 | -- | |
| Applegate Developers Llc | -- | -- | |
| Applegate Developers Llc | $62,000 | -- |
Source: Public Records
Mortgage History
| Date | Status | Borrower | Loan Amount |
|---|---|---|---|
| Previous Owner | Cantrell Bruce | $240,000 | |
| Previous Owner | Applegate Developers Llc | $256,308 |
Source: Public Records
Tax History Compared to Growth
Tax History
| Year | Tax Paid | Tax Assessment Tax Assessment Total Assessment is a certain percentage of the fair market value that is determined by local assessors to be the total taxable value of land and additions on the property. | Land | Improvement |
|---|---|---|---|---|
| 2024 | $5,111 | $204,640 | $27,720 | $176,920 |
| 2023 | $3,972 | $174,320 | $23,800 | $150,520 |
| 2022 | $3,610 | $138,000 | $11,240 | $126,760 |
| 2021 | $3,574 | $134,120 | $11,240 | $122,880 |
| 2020 | $3,558 | $129,720 | $6,760 | $122,960 |
| 2019 | $3,406 | $123,000 | $6,760 | $116,240 |
| 2018 | $3,336 | $116,600 | $6,760 | $109,840 |
| 2017 | $2,521 | $88,571 | $7,840 | $80,731 |
| 2016 | $2,462 | $88,571 | $7,840 | $80,731 |
| 2015 | $2,481 | $88,571 | $7,840 | $80,731 |
| 2014 | $2,481 | $88,571 | $7,840 | $80,731 |
Source: Public Records
Map
Nearby Homes
- 4603 Clarks Bridge Rd
- 4425 Clarks Bridge Rd
- 4368 Ed Henson Rd
- 5613 Bogus Rd
- 4449 Highland Gate Pkwy
- 4478 Highland Gate Pkwy Unit 78/79
- 4478 Highland Gate Pkwy
- 5163 Bogus Rd
- 4502 Highland Gate Pkwy Unit 73/74
- 4502 Highland Gate Pkwy
- 4542 Highland Gate Pkwy Unit 63
- 4542 Highland Gate Pkwy
- 4160 Topsail Ridge
- 4193 Cleveland Hwy Unit 26
- 4022 Sutton Rd Unit 25
- 0 C Rogers Rd Unit 10570308
- 3350 Lanier Cir
- 6120 River Run Cir
- 5367 Clarks Bridge Rd
- 5375 Clarks Bridge Rd
- 4567 Clarks Bridge Rd
- 4591 Clarks Bridge Rd Unit 8
- 4591 Clarks Bridge Rd
- 4720 Nopone Rd
- 4555 Clarks Bridge Rd
- 4611 Clarks Bridge Rd Unit 6
- 4736 Nopone Rd
- 4559 Clarks Bridge Rd
- 4744 Nopone Rd
- 4730 Nopone Rd
- 4752 Nopone Rd
- 4686 Nopone Rd
- 4566 Clarks Bridge Rd
- 4760 Nopone Rd
- 4452 Clarks Bridge Rd
- 4642 Clarks Bridge Rd
- 4648 Nopone Rd
- 4549 Clarks Bridge Rd
- 4545 Clarks Bridge Rd
- 4724 Glade Farm Rd