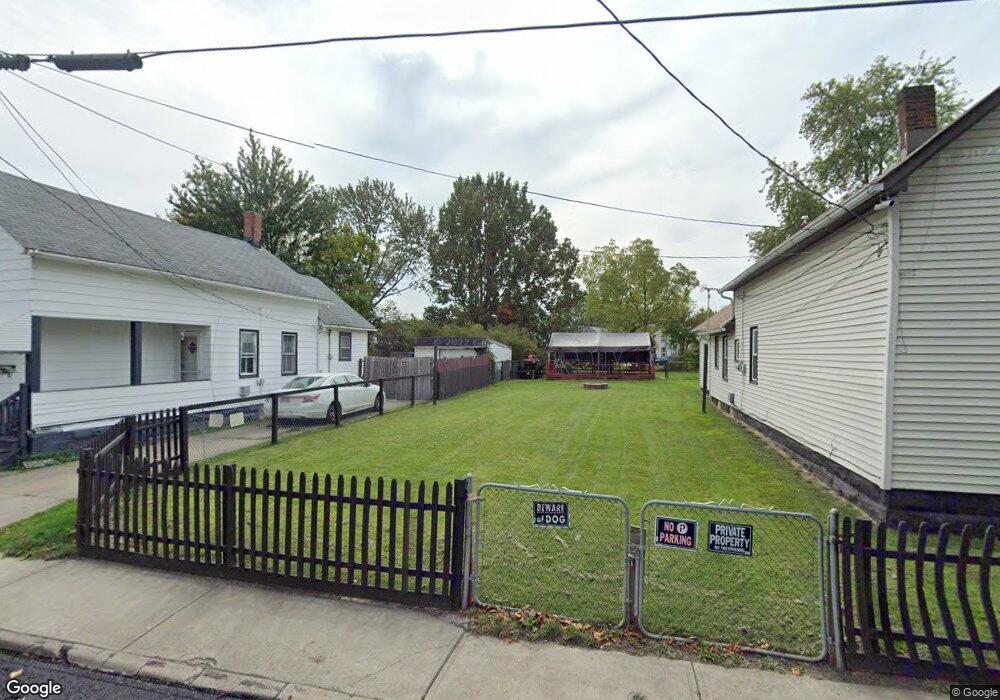
4579 Niessen Ct Cleveland, OH 44109
Clark-Fulton NeighborhoodEstimated Value: $40,085 - $91,000
2
Beds
1
Bath
792
Sq Ft
$96/Sq Ft
Est. Value
About This Home
This home is located at 4579 Niessen Ct, Cleveland, OH 44109 and is currently estimated at $76,021, approximately $95 per square foot. 4579 Niessen Ct is a home located in Cuyahoga County with nearby schools including Almira Academy, Benjamin Franklin, and Anton Grdina School.
Ownership History
Date
Name
Owned For
Owner Type
Purchase Details
Closed on
May 5, 2014
Sold by
The Cuyahoga County Land Reutilization C
Bought by
Taylor Kenneth and Taylor Elaine
Current Estimated Value
Purchase Details
Closed on
Jan 10, 2014
Sold by
Federal National Mortgage Association
Bought by
Cuyahoga County Land Reutilization Corpo
Purchase Details
Closed on
Sep 4, 2012
Sold by
Tannous George M
Bought by
Federal National Mortgage Association
Purchase Details
Closed on
Aug 8, 2005
Sold by
Deutsche Bank Trust Co
Bought by
Tannous Georges M
Purchase Details
Closed on
Jul 11, 2005
Sold by
Yachanin Charmaine
Bought by
Bankers Trust Co Of California Na
Purchase Details
Closed on
Dec 29, 1988
Sold by
Scheuerman Dale
Bought by
Yachanin Charmaine
Purchase Details
Closed on
Dec 9, 1977
Sold by
Otoole John J
Bought by
Scheuerman Dale
Purchase Details
Closed on
Jan 1, 1975
Bought by
Otoole John J
Create a Home Valuation Report for This Property
The Home Valuation Report is an in-depth analysis detailing your home's value as well as a comparison with similar homes in the area
Home Values in the Area
Average Home Value in this Area
Purchase History
| Date | Buyer | Sale Price | Title Company |
|---|---|---|---|
| Taylor Kenneth | -- | None Available | |
| Cuyahoga County Land Reutilization Corpo | $200 | Servicelink | |
| Federal National Mortgage Association | $52,302 | None Available | |
| Tannous Georges M | $10,500 | Resource Title Agency | |
| Bankers Trust Co Of California Na | $22,000 | Resource Title Agency | |
| Yachanin Charmaine | $6,000 | -- | |
| Scheuerman Dale | $7,200 | -- | |
| Otoole John J | -- | -- |
Source: Public Records
Tax History Compared to Growth
Tax History
| Year | Tax Paid | Tax Assessment Tax Assessment Total Assessment is a certain percentage of the fair market value that is determined by local assessors to be the total taxable value of land and additions on the property. | Land | Improvement |
|---|---|---|---|---|
| 2024 | $281 | $4,200 | $4,200 | -- |
| 2023 | $342 | $4,410 | $4,410 | $0 |
| 2022 | $340 | $4,410 | $4,410 | $0 |
| 2021 | $337 | $4,410 | $4,410 | $0 |
| 2020 | $300 | $3,400 | $3,400 | $0 |
| 2019 | $275 | $9,700 | $9,700 | $0 |
| 2018 | $274 | $3,400 | $3,400 | $0 |
| 2017 | $396 | $3,400 | $3,400 | $0 |
| 2016 | $323 | $3,400 | $3,400 | $0 |
| 2015 | $520 | $3,400 | $3,400 | $0 |
| 2014 | $520 | $3,400 | $3,400 | $0 |
Source: Public Records
Map
Nearby Homes
- 3295 W 44th St
- 3319 W 44th St
- 4571 Sackett Ave
- 4429 Hyde Ave
- 3207 W 44th St
- 3205 W 46th St
- 3252 W 41st St
- 3411 W 46th St
- 4144 Hyde Ave
- 3196 W 43rd St
- 3279 W 50th St
- 3273 W 50th St
- 3184 W 46th St
- 4131 Newark Ave
- 3284 W 50th St
- 3225 W 50th St
- 3325 W 52nd St
- 3914 Sackett Ave
- 3431 W 49th St
- 3420 W 49th St
- 4577 Niessen Ct
- 4583 Niessen Ct
- 4575 Niessen Ct
- 4587 Niessen Ct
- 4580 Niessen Ct
- 4574 Niessen Ct
- 4582 Niessen Ct
- 4572 Niessen Ct
- 4586 Niessen Ct
- 3285 W 46th St
- 3285 W 46th St Unit 626
- 3289 W 46th St
- 4570 Niessen Ct
- 3291 W 46th St
- 4502 Catharina Ave
- 4510 Catharina Ave
- 4438 Catharina Ave
- 3286 W 44th St
- 3288 W 44th St
- 4518 Catharina Ave