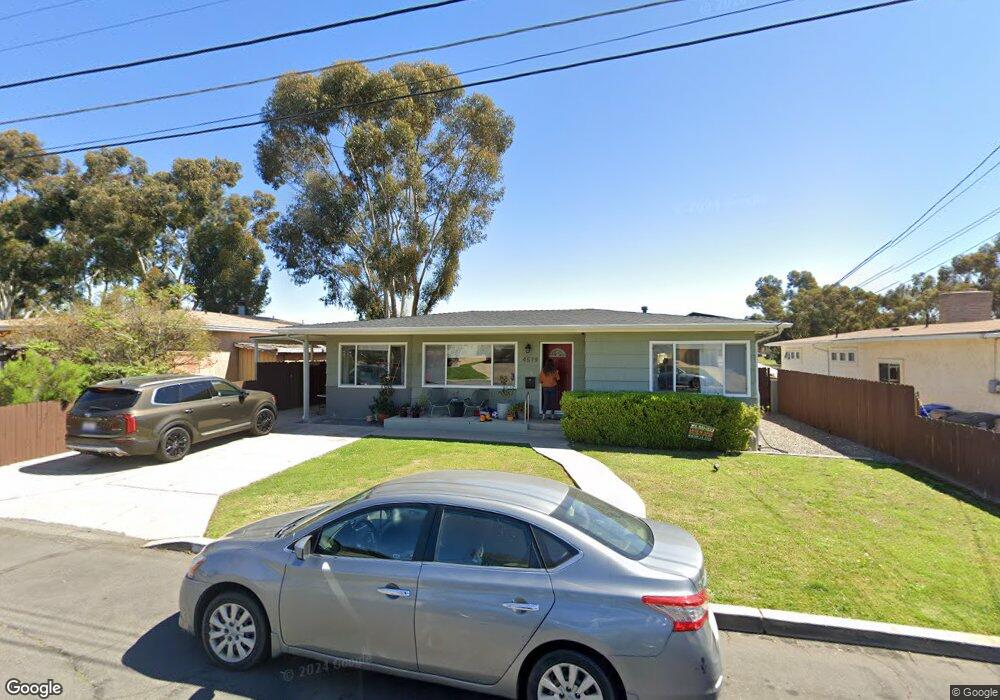
4579 Terry Ln La Mesa, CA 91942
Estimated Value: $802,000 - $1,005,000
4
Beds
2
Baths
1,506
Sq Ft
$598/Sq Ft
Est. Value
About This Home
This home is located at 4579 Terry Ln, La Mesa, CA 91942 and is currently estimated at $900,727, approximately $598 per square foot. 4579 Terry Ln is a home located in San Diego County with nearby schools including Rolando Elementary School, La Mesa Arts Academy, and Mount Miguel High School.
Ownership History
Date
Name
Owned For
Owner Type
Purchase Details
Closed on
Feb 10, 2025
Sold by
Vella Lisa M and Vella Alexandra A
Bought by
Lisa And Alexandra Vella 2025 Living Trust and Vella
Current Estimated Value
Purchase Details
Closed on
Jan 9, 2018
Sold by
Amino Homes Inc
Bought by
Vella Lisa M and Vella Alexandra A
Home Financials for this Owner
Home Financials are based on the most recent Mortgage that was taken out on this home.
Original Mortgage
$509,150
Interest Rate
3.94%
Mortgage Type
New Conventional
Purchase Details
Closed on
Oct 1, 2017
Sold by
Johnson Robert
Bought by
Amino Homes Inc
Home Financials for this Owner
Home Financials are based on the most recent Mortgage that was taken out on this home.
Original Mortgage
$370,000
Interest Rate
3.78%
Mortgage Type
Unknown
Purchase Details
Closed on
Jan 20, 2006
Sold by
Johnson Norman Edwin and Johnson Dolores Flanagan
Bought by
Johnson Norman Edwin and Johnson Dolores Flanagan
Purchase Details
Closed on
Jul 1, 1994
Sold by
Johnson Norman Edwin and Johnson Dolores Flanagan
Bought by
Johnson Norman Edwin and Johnson Dolores Flanagan
Create a Home Valuation Report for This Property
The Home Valuation Report is an in-depth analysis detailing your home's value as well as a comparison with similar homes in the area
Purchase History
| Date | Buyer | Sale Price | Title Company |
|---|---|---|---|
| Lisa And Alexandra Vella 2025 Living Trust | -- | None Listed On Document | |
| Vella Lisa M | $599,000 | Fidelity National Title | |
| Amino Homes Inc | $458,000 | Fidelity National Title Co | |
| Johnson Norman Edwin | -- | None Available | |
| Johnson Norman Edwin | -- | -- |
Source: Public Records
Mortgage History
| Date | Status | Borrower | Loan Amount |
|---|---|---|---|
| Previous Owner | Vella Lisa M | $509,150 | |
| Previous Owner | Amino Homes Inc | $370,000 |
Source: Public Records
Tax History
| Year | Tax Paid | Tax Assessment Tax Assessment Total Assessment is a certain percentage of the fair market value that is determined by local assessors to be the total taxable value of land and additions on the property. | Land | Improvement |
|---|---|---|---|---|
| 2025 | $8,660 | $681,552 | $532,744 | $148,808 |
| 2024 | $8,660 | $668,190 | $522,299 | $145,891 |
| 2023 | $8,431 | $655,089 | $512,058 | $143,031 |
| 2022 | $8,330 | $642,245 | $502,018 | $140,227 |
| 2021 | $8,153 | $629,653 | $492,175 | $137,478 |
| 2020 | $7,877 | $623,198 | $487,129 | $136,069 |
| 2019 | $7,659 | $610,979 | $477,578 | $133,401 |
| 2018 | $5,874 | $458,000 | $358,000 | $100,000 |
| 2017 | $932 | $51,711 | $20,080 | $31,631 |
| 2016 | $886 | $50,698 | $19,687 | $31,011 |
| 2015 | $860 | $49,938 | $19,392 | $30,546 |
| 2014 | $825 | $48,961 | $19,013 | $29,948 |
Source: Public Records
Map
Nearby Homes
- 4557 Toni Ln
- 4350 68th St
- 7118 Stanford Ave
- 6650 Vigo Dr
- 4376 Harbinson Ave
- 4445 Mataro Dr
- 6850 Rosefield Dr
- 4623 Alamo Dr
- 4790 70th St Unit 6
- 4245 69th St
- 7113 Purdue Ave
- 7222 Princeton Ave
- 4224 69th St
- 4844 68th St Unit 3
- 4227 69th St
- 6927 Amherst St Unit 3
- 6927 Amherst St Unit 1
- 6979-81 Amherst St
- 4461 Revillo Dr
- 6735 Amherst St Unit 1E
Your Personal Tour Guide
Ask me questions while you tour the home.