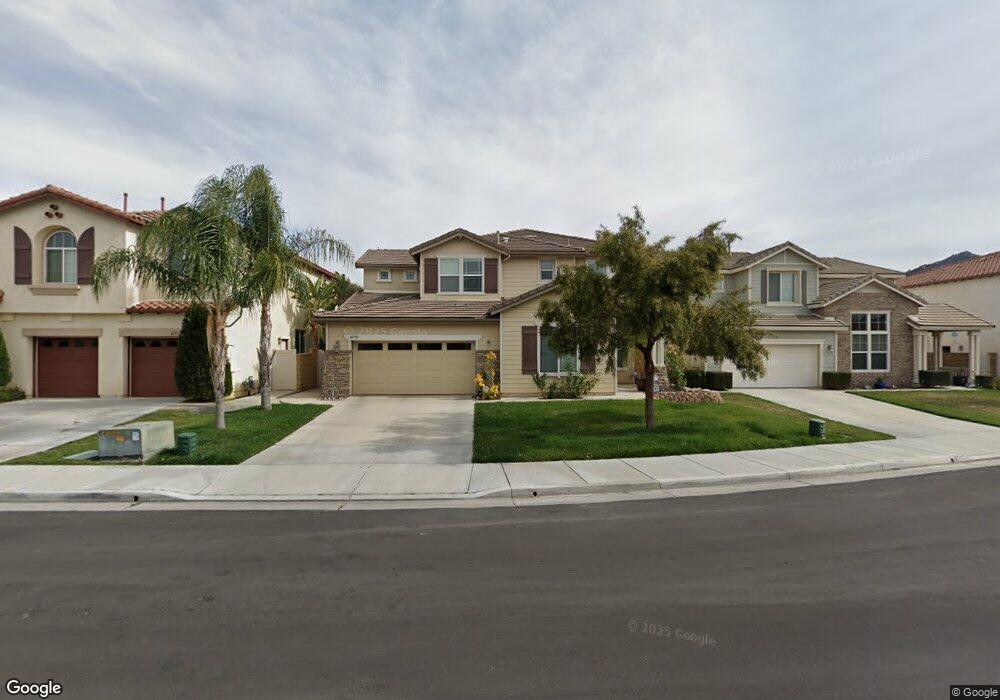
45790 Honeysuckle Ct Temecula, CA 92592
Wolf Creek NeighborhoodEstimated Value: $773,472 - $866,000
4
Beds
3
Baths
3,226
Sq Ft
$256/Sq Ft
Est. Value
About This Home
This home is located at 45790 Honeysuckle Ct, Temecula, CA 92592 and is currently estimated at $824,868, approximately $255 per square foot. 45790 Honeysuckle Ct is a home located in Riverside County with nearby schools including Temecula Luiseno Elementary, Erle Stanley Gardner Middle School, and Great Oak High School.
Ownership History
Date
Name
Owned For
Owner Type
Purchase Details
Closed on
Feb 18, 2024
Sold by
Nguyen Tri Anh and Phan Thanh-Tuyen Thi
Bought by
Nguyen-Phan Living Trust and Nguyen
Current Estimated Value
Purchase Details
Closed on
Mar 29, 2010
Sold by
Gmac Mortgage Llc
Bought by
Nguyen Tri Anh and Phan Thanh Tuyen Thi
Home Financials for this Owner
Home Financials are based on the most recent Mortgage that was taken out on this home.
Original Mortgage
$262,800
Interest Rate
4.91%
Mortgage Type
New Conventional
Purchase Details
Closed on
Jun 3, 2009
Sold by
Rasmussen Chris
Bought by
Gmac Mortgage Llc and Gmac Mortgage Corporation
Purchase Details
Closed on
Jan 16, 2007
Sold by
Rasmussen Christopher M
Bought by
Rasmussen Chris
Purchase Details
Closed on
Jun 15, 2006
Sold by
Woodside Wolf Creek 127 Inc
Bought by
Rasmussen Christopher M
Home Financials for this Owner
Home Financials are based on the most recent Mortgage that was taken out on this home.
Original Mortgage
$391,080
Interest Rate
7.49%
Mortgage Type
Purchase Money Mortgage
Create a Home Valuation Report for This Property
The Home Valuation Report is an in-depth analysis detailing your home's value as well as a comparison with similar homes in the area
Home Values in the Area
Average Home Value in this Area
Purchase History
| Date | Buyer | Sale Price | Title Company |
|---|---|---|---|
| Nguyen-Phan Living Trust | -- | None Listed On Document | |
| Nguyen Tri Anh | $328,500 | Fidelity National Title Co | |
| Gmac Mortgage Llc | $278,100 | None Available | |
| Rasmussen Chris | -- | Accommodation | |
| Rasmussen Christopher M | $489,000 | Fidelity National Title Co |
Source: Public Records
Mortgage History
| Date | Status | Borrower | Loan Amount |
|---|---|---|---|
| Previous Owner | Nguyen Tri Anh | $262,800 | |
| Previous Owner | Rasmussen Christopher M | $391,080 |
Source: Public Records
Tax History
| Year | Tax Paid | Tax Assessment Tax Assessment Total Assessment is a certain percentage of the fair market value that is determined by local assessors to be the total taxable value of land and additions on the property. | Land | Improvement |
|---|---|---|---|---|
| 2025 | $7,385 | $424,016 | $90,346 | $333,670 |
| 2023 | $7,385 | $407,553 | $86,839 | $320,714 |
| 2022 | $7,288 | $399,563 | $85,137 | $314,426 |
| 2021 | $7,270 | $391,729 | $83,468 | $308,261 |
| 2020 | $7,212 | $387,714 | $82,613 | $305,101 |
| 2019 | $7,150 | $380,113 | $80,994 | $299,119 |
| 2018 | $7,064 | $372,660 | $79,407 | $293,253 |
| 2017 | $6,977 | $365,353 | $77,850 | $287,503 |
| 2016 | $6,889 | $358,190 | $76,324 | $281,866 |
| 2015 | $6,813 | $352,812 | $75,179 | $277,633 |
| 2014 | $6,680 | $345,903 | $73,707 | $272,196 |
Source: Public Records
Map
Nearby Homes
- 31348 Huron St
- 31579 Mendocino Ct
- 31218 Comotilo Ct
- 45590 Alpine Place
- 31155 Lahontan St
- 31109 Shicali Ct
- 45374 Zuma Dr
- 31352 Via Eduardo
- 31814 Murdock Ln
- 45511 Seagull Way
- 45495 Peacock Place
- 45320 Esmerado Ct
- 45303 Esmerado Ct
- 45418 Seagull Way
- 31935 Bitterroot Ct
- 31937 Red Pine Way Unit 80
- 31889 Red Pine Way
- 31545 Via Cordoba
- 45763 Via Nubes
- 31868 Corte Montoya
- 45778 Honeysuckle Ct
- 45802 Honeysuckle Ct
- 31501 Six Rivers Ct
- 45766 Honeysuckle Ct
- 45785 Sierra Ct
- 45814 Honeysuckle Ct
- 31509 Six Rivers Ct
- 45781 Sierra Ct
- 45754 Honeysuckle Ct
- 45787 Honeysuckle Ct
- 45775 Honeysuckle Ct
- 45793 Sierra Ct
- 31513 Six Rivers Ct
- 45799 Honeysuckle Ct
- 45763 Honeysuckle Ct
- 31525 Six Rivers Ct
- 45789 Sierra Ct
- 45811 Honeysuckle Ct
- 45742 Honeysuckle Ct
- 31517 Six Rivers Ct
Your Personal Tour Guide
Ask me questions while you tour the home.