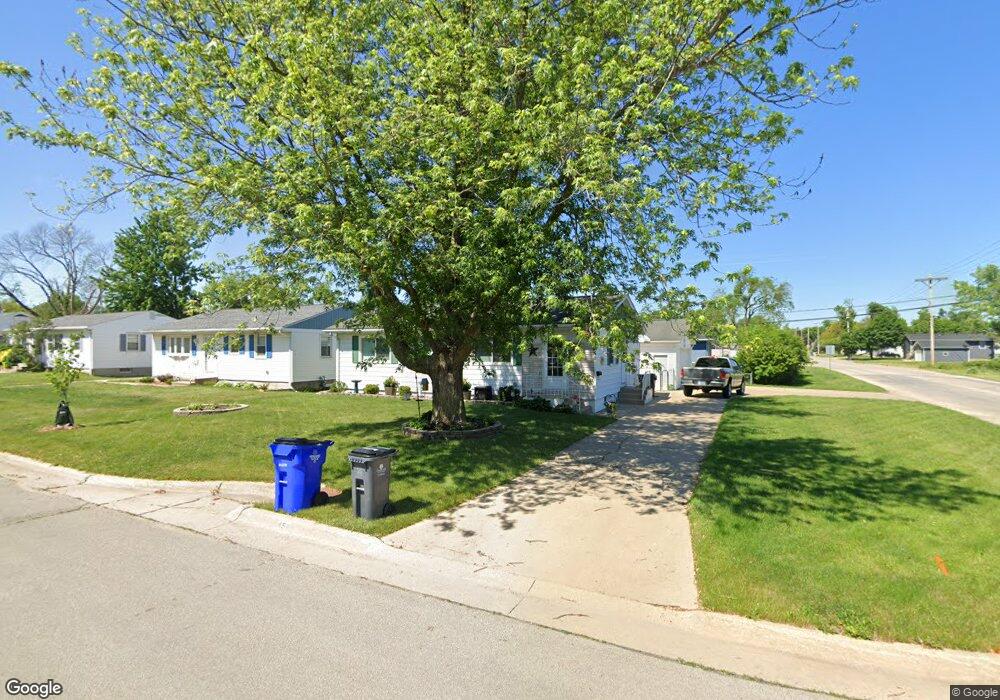
458 22nd St NW Cedar Rapids, IA 52405
Estimated Value: $180,320 - $188,000
3
Beds
2
Baths
988
Sq Ft
$187/Sq Ft
Est. Value
About This Home
This home is located at 458 22nd St NW, Cedar Rapids, IA 52405 and is currently estimated at $184,580, approximately $186 per square foot. 458 22nd St NW is a home located in Linn County with nearby schools including Junction City Elementary School, Cleveland Elementary School, and Kentucky Tech - Ashland Reg Tech Center.
Ownership History
Date
Name
Owned For
Owner Type
Purchase Details
Closed on
Jun 17, 2016
Sold by
Paulus Tamara K and Paulus Ryan
Bought by
Bagby Joshua
Current Estimated Value
Home Financials for this Owner
Home Financials are based on the most recent Mortgage that was taken out on this home.
Original Mortgage
$118,988
Outstanding Balance
$94,732
Interest Rate
3.58%
Mortgage Type
New Conventional
Estimated Equity
$89,848
Purchase Details
Closed on
Feb 28, 2007
Sold by
Kopeeky Shannon D and Kopeeky Danielle P
Bought by
Kopecky Tamara K
Home Financials for this Owner
Home Financials are based on the most recent Mortgage that was taken out on this home.
Original Mortgage
$88,000
Interest Rate
5.75%
Mortgage Type
Purchase Money Mortgage
Purchase Details
Closed on
Sep 17, 2002
Sold by
Christiansen Timothy A and Christiansen Gail A
Bought by
Kopecky Shannon D
Home Financials for this Owner
Home Financials are based on the most recent Mortgage that was taken out on this home.
Original Mortgage
$88,200
Interest Rate
6.24%
Create a Home Valuation Report for This Property
The Home Valuation Report is an in-depth analysis detailing your home's value as well as a comparison with similar homes in the area
Home Values in the Area
Average Home Value in this Area
Purchase History
| Date | Buyer | Sale Price | Title Company |
|---|---|---|---|
| Bagby Joshua | -- | None Available | |
| Kopecky Tamara K | $109,500 | None Available | |
| Kopecky Shannon D | $97,500 | -- |
Source: Public Records
Mortgage History
| Date | Status | Borrower | Loan Amount |
|---|---|---|---|
| Open | Bagby Joshua | $118,988 | |
| Previous Owner | Kopecky Tamara K | $88,000 | |
| Previous Owner | Kopecky Shannon D | $88,200 |
Source: Public Records
Tax History Compared to Growth
Tax History
| Year | Tax Paid | Tax Assessment Tax Assessment Total Assessment is a certain percentage of the fair market value that is determined by local assessors to be the total taxable value of land and additions on the property. | Land | Improvement |
|---|---|---|---|---|
| 2025 | $2,806 | $175,000 | $32,800 | $142,200 |
| 2024 | $2,896 | $167,100 | $30,000 | $137,100 |
| 2023 | $2,896 | $158,600 | $30,000 | $128,600 |
| 2022 | $2,630 | $137,300 | $25,700 | $111,600 |
| 2021 | $2,676 | $127,000 | $25,700 | $101,300 |
| 2020 | $2,676 | $121,300 | $22,800 | $98,500 |
| 2019 | $2,484 | $115,200 | $22,800 | $92,400 |
| 2018 | $2,414 | $115,200 | $22,800 | $92,400 |
| 2017 | $2,238 | $111,300 | $22,800 | $88,500 |
| 2016 | $2,367 | $111,400 | $22,800 | $88,600 |
| 2015 | $2,182 | $116,202 | $22,823 | $93,379 |
| 2014 | $2,288 | $116,202 | $22,823 | $93,379 |
| 2013 | $2,234 | $116,202 | $22,823 | $93,379 |
Source: Public Records
Map
Nearby Homes
- 451 23rd St NW
- 615 27th St NW
- 623 27th St NW
- 312 24th Ave NW
- 425 28th St NW
- 949 Westwood Dr NW
- 1860 E Ave NW
- 2623 Iris Ave NW
- 159 26th St NW
- 912 29th St NW
- 1814 Shawnee Ct NW
- 3107 Johnson Ave NW Unit 4
- 225 31st St NW
- 1410 Adair Ct SW Unit Lot 2
- 327 NW Edgewood Rd Unit 324, 330, 336, 342 C
- 290 Highland Dr NW
- 3312 G Ave NW
- 2433 8th Ave SW
- 263 Highland Dr NW
- 3013 Sue Ln NW