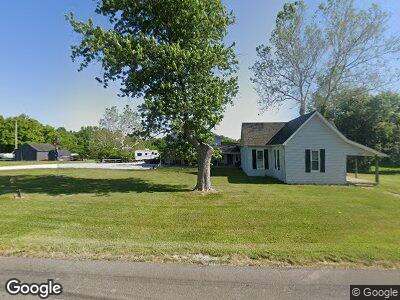
458 E 775 S Nineveh, IN 46164
Estimated Value: $221,000 - $457,000
4
Beds
3
Baths
2,802
Sq Ft
$122/Sq Ft
Est. Value
About This Home
This home is located at 458 E 775 S, Nineveh, IN 46164 and is currently estimated at $342,766, approximately $122 per square foot. 458 E 775 S is a home located in Johnson County with nearby schools including Indian Creek Elementary School, Indian Creek Intermediate School, and Indian Creek Middle School.
Ownership History
Date
Name
Owned For
Owner Type
Purchase Details
Closed on
May 28, 2021
Sold by
Radtke Daniel P
Bought by
Fitzpatrick Angela K
Current Estimated Value
Home Financials for this Owner
Home Financials are based on the most recent Mortgage that was taken out on this home.
Original Mortgage
$260,988
Outstanding Balance
$240,874
Interest Rate
2.9%
Mortgage Type
FHA
Estimated Equity
$149,202
Purchase Details
Closed on
Nov 7, 2018
Sold by
Radtke Daniel P and Radtke Heather N
Bought by
Radtke Daniel P
Home Financials for this Owner
Home Financials are based on the most recent Mortgage that was taken out on this home.
Original Mortgage
$188,000
Interest Rate
4.7%
Mortgage Type
New Conventional
Purchase Details
Closed on
Sep 2, 2015
Sold by
Cathcart Donald J and Cathcart Sandi A
Bought by
Radtke Daniel P and Summitt Heather N
Home Financials for this Owner
Home Financials are based on the most recent Mortgage that was taken out on this home.
Original Mortgage
$160,550
Interest Rate
3.91%
Mortgage Type
New Conventional
Create a Home Valuation Report for This Property
The Home Valuation Report is an in-depth analysis detailing your home's value as well as a comparison with similar homes in the area
Home Values in the Area
Average Home Value in this Area
Purchase History
| Date | Buyer | Sale Price | Title Company |
|---|---|---|---|
| Fitzpatrick Angela K | $285,000 | Ata National Title | |
| Radtke Daniel P | -- | None Available | |
| Radtke Daniel P | -- | None Available |
Source: Public Records
Mortgage History
| Date | Status | Borrower | Loan Amount |
|---|---|---|---|
| Open | Fitzpatrick Angela K | $260,988 | |
| Closed | Fitzpatrick Angela K | $260,988 | |
| Previous Owner | Radtke Daniel P | $188,000 | |
| Previous Owner | Radtke Daniel P | $160,550 | |
| Previous Owner | Cathcart Sandi A | $100,000 |
Source: Public Records
Tax History Compared to Growth
Tax History
| Year | Tax Paid | Tax Assessment Tax Assessment Total Assessment is a certain percentage of the fair market value that is determined by local assessors to be the total taxable value of land and additions on the property. | Land | Improvement |
|---|---|---|---|---|
| 2024 | $1,534 | $240,200 | $53,100 | $187,100 |
| 2023 | $1,534 | $218,500 | $48,600 | $169,900 |
| 2022 | $1,377 | $194,100 | $40,100 | $154,000 |
| 2021 | $2,492 | $259,200 | $124,000 | $135,200 |
| 2020 | $2,204 | $260,000 | $124,000 | $136,000 |
| 2019 | $2,097 | $251,600 | $124,000 | $127,600 |
| 2018 | $1,999 | $241,400 | $124,000 | $117,400 |
| 2017 | $2,023 | $241,700 | $124,000 | $117,700 |
| 2016 | $1,846 | $241,000 | $124,000 | $117,000 |
| 2014 | $1,785 | $241,100 | $124,000 | $117,100 |
| 2013 | $1,785 | $239,700 | $124,000 | $115,700 |
Source: Public Records
Map
Nearby Homes
- 7984 S Deer Lake Dr
- 268 E Hoover Dr
- 515 Hoover Dr
- 8644 S Kinman Dr
- 8329 S Christian Dr
- 8598 S Riser Dr
- 8657 S Nash Dr
- 409 W Lakeview Dr
- 459 W Lakeview Dr
- 0 Hinshaw Dr
- 387 W Roszell Dr
- 8460 S Green Dr
- 0 Nineveh Rd Unit MBR22036802
- 1828 W 750 S
- 8205 Bass Dr
- 0 Aspen Dr Unit MBR22027222
- 6968 S 300 W
- 8218 Sweetwater Dr
- 8157 Center Lake Rd
- 7018 Drum Dr