Estimated Value: $466,000 - $532,000
5
Beds
2
Baths
1,850
Sq Ft
$271/Sq Ft
Est. Value
About This Home
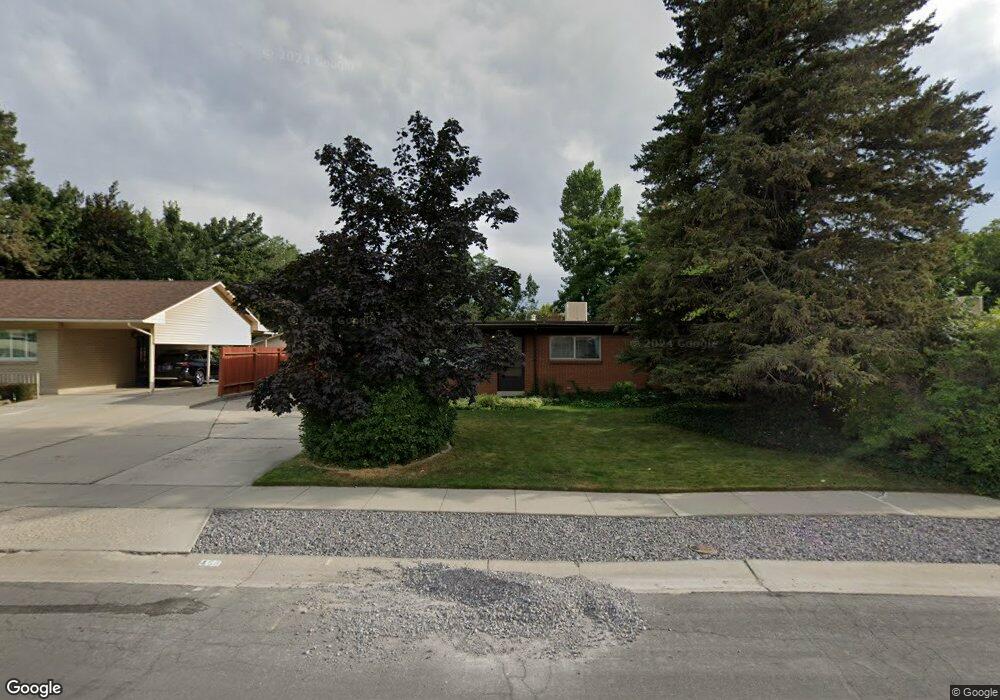
This home is located at 458 E 8260 S, Sandy, UT 84070 and is currently estimated at $500,624, approximately $270 per square foot. 458 E 8260 S is a home located in Salt Lake County with nearby schools including Midvalley Elementary School, Union Middle School, and Hillcrest High School.
Ownership History
Date
Name
Owned For
Owner Type
Purchase Details
Closed on
Jul 9, 2014
Sold by
Youngblood Zachary S
Bought by
Youngblood Zachary S and Youngblood Emily C
Current Estimated Value
Home Financials for this Owner
Home Financials are based on the most recent Mortgage that was taken out on this home.
Original Mortgage
$202,825
Outstanding Balance
$153,969
Interest Rate
4.07%
Mortgage Type
New Conventional
Estimated Equity
$346,655
Purchase Details
Closed on
Jan 10, 2005
Sold by
Ormsbee Van K
Bought by
Demann Jared L
Home Financials for this Owner
Home Financials are based on the most recent Mortgage that was taken out on this home.
Original Mortgage
$30,800
Interest Rate
5.8%
Mortgage Type
Stand Alone Second
Purchase Details
Closed on
Sep 14, 2001
Sold by
Reed Adam G and Reed Cassandra O
Bought by
Ormsbee Van K
Home Financials for this Owner
Home Financials are based on the most recent Mortgage that was taken out on this home.
Original Mortgage
$135,850
Interest Rate
7%
Create a Home Valuation Report for This Property
The Home Valuation Report is an in-depth analysis detailing your home's value as well as a comparison with similar homes in the area
Home Values in the Area
Average Home Value in this Area
Purchase History
| Date | Buyer | Sale Price | Title Company |
|---|---|---|---|
| Youngblood Zachary S | -- | Us Title | |
| Youngblood Zachary S | -- | Us Title | |
| Demann Jared L | -- | Inwest Title Services | |
| Ormsbee Van K | -- | Superior Title |
Source: Public Records
Mortgage History
| Date | Status | Borrower | Loan Amount |
|---|---|---|---|
| Open | Youngblood Zachary S | $202,825 | |
| Previous Owner | Demann Jared L | $30,800 | |
| Previous Owner | Demann Jared L | $123,200 | |
| Previous Owner | Ormsbee Van K | $135,850 |
Source: Public Records
Tax History
| Year | Tax Paid | Tax Assessment Tax Assessment Total Assessment is a certain percentage of the fair market value that is determined by local assessors to be the total taxable value of land and additions on the property. | Land | Improvement |
|---|---|---|---|---|
| 2025 | $2,337 | $437,300 | $128,500 | $308,800 |
| 2024 | $2,337 | $431,600 | $120,800 | $310,800 |
| 2023 | $2,030 | $373,900 | $114,800 | $259,100 |
| 2022 | $2,127 | $383,100 | $112,600 | $270,500 |
| 2021 | $1,914 | $293,000 | $97,900 | $195,100 |
| 2020 | $1,815 | $262,100 | $79,300 | $182,800 |
| 2019 | $1,767 | $248,600 | $79,300 | $169,300 |
| 2016 | $1,817 | $206,600 | $70,500 | $136,100 |
Source: Public Records
Map
Nearby Homes
- 8322 S Levine Ln Unit 111
- 8260 S 560 E
- 359 E 8400 S
- 8459 S 300 E
- 8087 S 615 E
- 274 E Water Mill Way Unit 230
- 227 E St Germain Way
- 257 Water Mill Way Unit 211
- 257 E Water Mill Way
- 744 E 8425 S
- 393 E Corral Creek Dr
- 760 E 8080 S
- 144 E Chambord Ct
- 379 E Horse Creek Dr
- 140 E Chambord Ct
- 138 E Chambord Ct
- 136 E Chambord Ct
- 132 E Chambord Ct
- 627 E 8680 S
- 194 Pioneer Ave
Your Personal Tour Guide
Ask me questions while you tour the home.