458 High St Torrington, CT 06790
Estimated Value: $227,000 - $262,000
3
Beds
6
Baths
1,509
Sq Ft
$165/Sq Ft
Est. Value
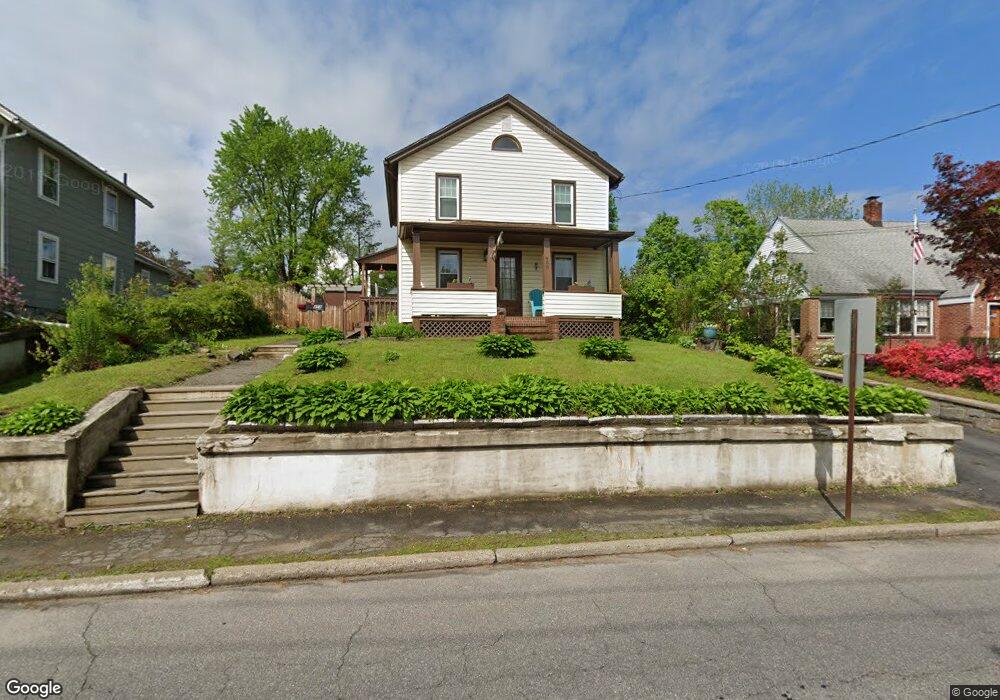
About This Home
This home is located at 458 High St, Torrington, CT 06790 and is currently estimated at $249,013, approximately $165 per square foot. 458 High St is a home located in Litchfield County with nearby schools including Torrington Middle School, Torrington High School, and Brooker Memorial CC & Learning Center.
Ownership History
Date
Name
Owned For
Owner Type
Purchase Details
Closed on
Sep 5, 2014
Sold by
Bergeron Jeffrey D
Bought by
Bergeron Jena Y
Current Estimated Value
Purchase Details
Closed on
Dec 22, 2009
Sold by
Husband Donald
Bought by
Bergeron Jeffrey D and Bergeron Jena Y
Home Financials for this Owner
Home Financials are based on the most recent Mortgage that was taken out on this home.
Original Mortgage
$91,200
Interest Rate
5%
Purchase Details
Closed on
Apr 24, 2002
Sold by
Zygmont Edward S and Zygmont Susan K
Bought by
Husband Donald and Smith Kirstie E
Home Financials for this Owner
Home Financials are based on the most recent Mortgage that was taken out on this home.
Original Mortgage
$104,220
Interest Rate
9.65%
Purchase Details
Closed on
Aug 1, 1997
Sold by
Schultz David M and Schultz Barbara I
Bought by
Zygmont Edward S and Zygmont Susan K
Purchase Details
Closed on
Jul 20, 1987
Sold by
Cordani J Patrick J
Bought by
Zygmont Edward S
Create a Home Valuation Report for This Property
The Home Valuation Report is an in-depth analysis detailing your home's value as well as a comparison with similar homes in the area
Home Values in the Area
Average Home Value in this Area
Purchase History
| Date | Buyer | Sale Price | Title Company |
|---|---|---|---|
| Bergeron Jena Y | -- | -- | |
| Bergeron Jeffrey D | $96,000 | -- | |
| Husband Donald | $115,800 | -- | |
| Zygmont Edward S | $60,000 | -- | |
| Zygmont Edward S | $126,000 | -- |
Source: Public Records
Mortgage History
| Date | Status | Borrower | Loan Amount |
|---|---|---|---|
| Previous Owner | Zygmont Edward S | $91,200 | |
| Previous Owner | Zygmont Edward S | $108,000 | |
| Previous Owner | Zygmont Edward S | $104,220 |
Source: Public Records
Tax History Compared to Growth
Tax History
| Year | Tax Paid | Tax Assessment Tax Assessment Total Assessment is a certain percentage of the fair market value that is determined by local assessors to be the total taxable value of land and additions on the property. | Land | Improvement |
|---|---|---|---|---|
| 2025 | $5,765 | $149,940 | $19,320 | $130,620 |
| 2024 | $3,417 | $71,230 | $19,360 | $51,870 |
| 2023 | $3,416 | $71,230 | $19,360 | $51,870 |
| 2022 | $3,358 | $71,230 | $19,360 | $51,870 |
| 2021 | $3,289 | $71,230 | $19,360 | $51,870 |
| 2020 | $3,289 | $71,230 | $19,360 | $51,870 |
| 2019 | $3,350 | $72,560 | $19,340 | $53,220 |
| 2018 | $3,350 | $72,560 | $19,340 | $53,220 |
| 2017 | $3,320 | $72,560 | $19,340 | $53,220 |
| 2016 | $3,320 | $72,560 | $19,340 | $53,220 |
| 2015 | $3,320 | $72,560 | $19,340 | $53,220 |
| 2014 | $3,671 | $101,080 | $40,310 | $60,770 |
Source: Public Records
Map
Nearby Homes
- 149 Turner Ave
- 75 Maple St
- 21 Roosevelt Ave
- 10 Irene St
- 168 Blake St
- 271 S Main St
- 231 Beechwood Ave
- 121 Culvert St
- 393 S Main St
- 30 Culvert St
- 37 Linden St
- 244 Hawthorne Terrace
- 77 Chestnut Ave
- 77 Marion Ave Unit 2
- 27 Washington Ave
- 615 S Main St
- 136 Wyoming Ave
- 95 Colorado Ave N
- 184 Harwinton Ave
- 53 Harwinton Ave Unit 4