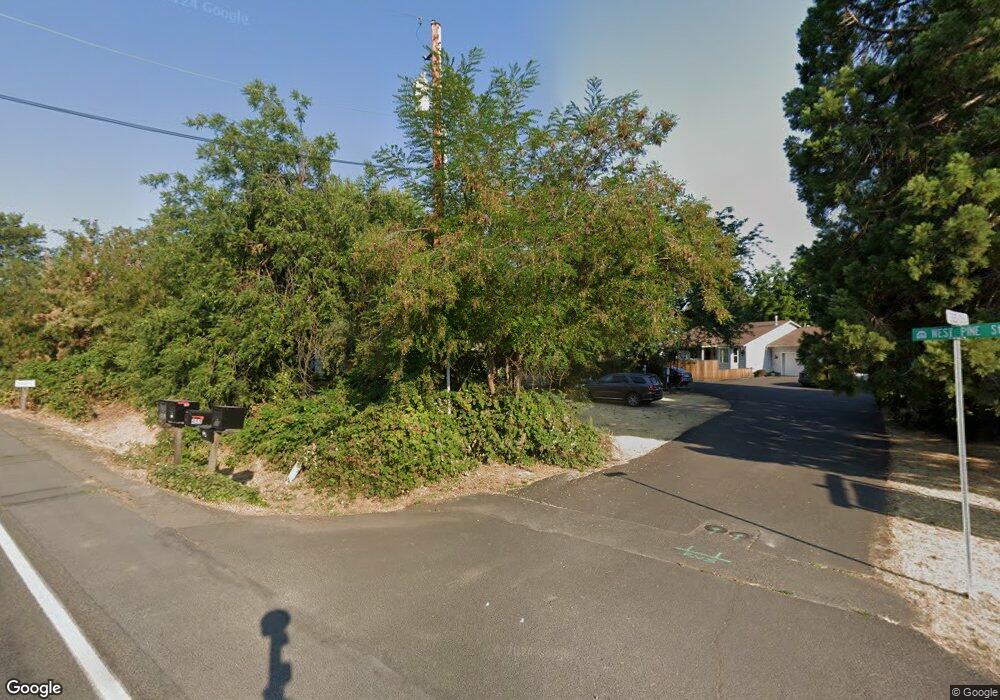
458 W Pine St Central Point, OR 97502
Estimated Value: $337,000 - $353,000
3
Beds
2
Baths
1,252
Sq Ft
$275/Sq Ft
Est. Value
About This Home
This home is located at 458 W Pine St, Central Point, OR 97502 and is currently estimated at $344,359, approximately $275 per square foot. 458 W Pine St is a home located in Jackson County with nearby schools including Richardson Elementary School, Scenic Middle School, and Crater High School.
Ownership History
Date
Name
Owned For
Owner Type
Purchase Details
Closed on
Aug 9, 2019
Sold by
Gorham Michael F
Bought by
Gorham Michael F and Gutierrez Gorham Anna M
Current Estimated Value
Purchase Details
Closed on
Sep 8, 2017
Sold by
Gorham Michael F and Gorham Sherry H
Bought by
Gorham Michael F
Purchase Details
Closed on
Jun 24, 2009
Sold by
Dekorte James D and Dekorte Carol J
Bought by
Gorham Michael F and Gorham Sherry H
Home Financials for this Owner
Home Financials are based on the most recent Mortgage that was taken out on this home.
Original Mortgage
$150,000
Interest Rate
4.83%
Mortgage Type
Seller Take Back
Purchase Details
Closed on
Jan 23, 2002
Sold by
Maxwell Carl E and Maxwell Jean
Bought by
Dekorte James D and Dekorte Carol J
Create a Home Valuation Report for This Property
The Home Valuation Report is an in-depth analysis detailing your home's value as well as a comparison with similar homes in the area
Home Values in the Area
Average Home Value in this Area
Purchase History
| Date | Buyer | Sale Price | Title Company |
|---|---|---|---|
| Gorham Michael F | -- | Accommodation | |
| Gorham Michael F | -- | None Available | |
| Gorham Michael F | $150,000 | Amerititle | |
| Dekorte James D | $150,000 | Amerititle Inc |
Source: Public Records
Mortgage History
| Date | Status | Borrower | Loan Amount |
|---|---|---|---|
| Closed | Gorham Michael F | $150,000 |
Source: Public Records
Tax History Compared to Growth
Tax History
| Year | Tax Paid | Tax Assessment Tax Assessment Total Assessment is a certain percentage of the fair market value that is determined by local assessors to be the total taxable value of land and additions on the property. | Land | Improvement |
|---|---|---|---|---|
| 2025 | $2,352 | $125,890 | $58,730 | $67,160 |
| 2024 | $2,352 | $122,230 | $57,030 | $65,200 |
| 2023 | $2,527 | $118,670 | $55,370 | $63,300 |
| 2022 | $1,979 | $118,670 | $55,370 | $63,300 |
| 2021 | $2,170 | $115,220 | $53,760 | $61,460 |
| 2020 | $2,100 | $111,870 | $52,190 | $59,680 |
| 2019 | $1,820 | $105,460 | $49,190 | $56,270 |
| 2018 | $1,765 | $102,390 | $47,760 | $54,630 |
| 2017 | $1,720 | $102,390 | $47,760 | $54,630 |
| 2016 | $1,670 | $96,520 | $45,020 | $51,500 |
| 2015 | $1,600 | $96,520 | $45,020 | $51,500 |
| 2014 | $1,560 | $90,990 | $42,440 | $48,550 |
Source: Public Records
Map
Nearby Homes
- 21 Hickory Ln
- 25 Donna Way
- 349 W Pine St
- 619 Palo Verde Way
- 487 Creekside Cir
- 465 Creekside Cir
- 420 Mayberry Ln
- 570 Bachand Cir
- 407 Silver Creek Dr
- 429 Mayberry Ln
- 659 Jackson Creek Dr
- 3642 Oak Pine Way
- 871 Holley Way
- 626 Griffin Oaks Dr
- 3364 Snowy Butte Ln
- 895 Holley Way
- 114 Cedar St
- 3506 New Ray Rd
- 1134 Steamboat Dr
- 1135 Shake Dr