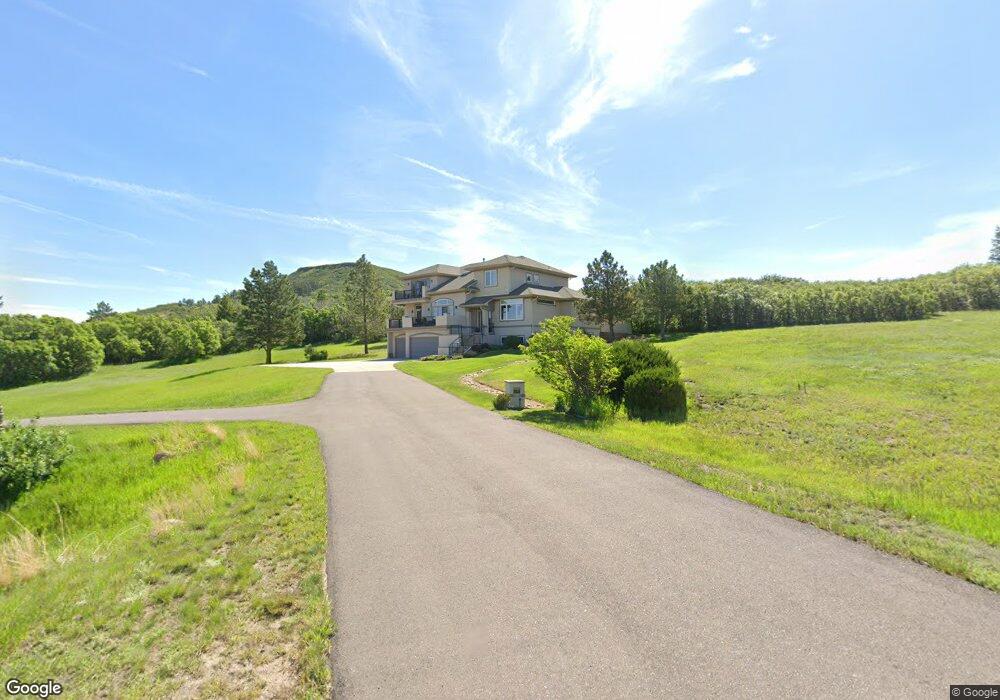
4582 High Spring Rd Castle Rock, CO 80104
Bell Mountain Ranch NeighborhoodEstimated Value: $1,096,372 - $1,305,000
3
Beds
3
Baths
3,502
Sq Ft
$347/Sq Ft
Est. Value
About This Home
This home is located at 4582 High Spring Rd, Castle Rock, CO 80104 and is currently estimated at $1,214,093, approximately $346 per square foot. 4582 High Spring Rd is a home located in Douglas County with nearby schools including South Ridge Elementary: An International Baccalaureate World School, Mesa Middle School, and Douglas County High School.
Ownership History
Date
Name
Owned For
Owner Type
Purchase Details
Closed on
Jul 28, 2005
Sold by
Loprinzi Philip George
Bought by
Frazier John V and Frazier Nicole G
Current Estimated Value
Home Financials for this Owner
Home Financials are based on the most recent Mortgage that was taken out on this home.
Original Mortgage
$500,000
Outstanding Balance
$257,518
Interest Rate
5.75%
Mortgage Type
Unknown
Estimated Equity
$956,575
Purchase Details
Closed on
Dec 11, 2000
Sold by
Genesee Custom Homes
Bought by
Loprinzi Philip George
Home Financials for this Owner
Home Financials are based on the most recent Mortgage that was taken out on this home.
Original Mortgage
$271,900
Interest Rate
7.72%
Purchase Details
Closed on
Mar 31, 1999
Sold by
Bell Mtn Ranch Assoc
Bought by
Genesee Custom Homes Inc
Create a Home Valuation Report for This Property
The Home Valuation Report is an in-depth analysis detailing your home's value as well as a comparison with similar homes in the area
Home Values in the Area
Average Home Value in this Area
Purchase History
| Date | Buyer | Sale Price | Title Company |
|---|---|---|---|
| Frazier John V | $644,000 | Land Title | |
| Loprinzi Philip George | $575,000 | -- | |
| Genesee Custom Homes Inc | $536,000 | -- |
Source: Public Records
Mortgage History
| Date | Status | Borrower | Loan Amount |
|---|---|---|---|
| Open | Frazier John V | $500,000 | |
| Previous Owner | Loprinzi Philip George | $271,900 | |
| Closed | Loprinzi Philip George | $188,100 |
Source: Public Records
Tax History
| Year | Tax Paid | Tax Assessment Tax Assessment Total Assessment is a certain percentage of the fair market value that is determined by local assessors to be the total taxable value of land and additions on the property. | Land | Improvement |
|---|---|---|---|---|
| 2025 | $10,134 | $71,120 | $17,760 | $53,360 |
| 2024 | $10,134 | $76,660 | $22,750 | $53,910 |
| 2023 | $10,100 | $76,660 | $22,750 | $53,910 |
| 2022 | $7,994 | $54,240 | $13,690 | $40,550 |
| 2021 | $8,227 | $54,240 | $13,690 | $40,550 |
| 2020 | $7,953 | $51,160 | $11,450 | $39,710 |
| 2019 | $8,481 | $51,160 | $11,450 | $39,710 |
| 2018 | $7,815 | $46,660 | $7,650 | $39,010 |
| 2017 | $7,540 | $46,660 | $7,650 | $39,010 |
| 2016 | $7,002 | $42,920 | $9,950 | $32,970 |
| 2015 | $6,913 | $42,920 | $9,950 | $32,970 |
| 2014 | $6,119 | $35,780 | $9,550 | $26,230 |
Source: Public Records
Map
Nearby Homes
- 3589 Winterhawk Cir
- 1283 Glade Gulch Rd
- 3440 Medallion Rd
- 467 Scrubjay Trail
- 124 Scrubjay Ln
- 1420 Deherder Dr
- 1477 Deherder Dr
- 5681 Water Avens Dr
- 5990 Hickory Oaks Trail
- 5665 Shadescale Way
- 131 Leafy Aster Ln
- 532 Woodroot Cir
- 1785 War Knot Ln
- 289 Leafy Aster Ln
- 734 Alumroot St
- 5955 Plains End Ct
- 5910 Riesberg Ln
- 1986 Shadow Creek Dr
- 5531 Renbarger St
- 1158 Brotherton Point
- 4578 High Spring Rd
- 4586 High Spring Rd
- 4581 High Spring Rd
- 4561 High Spring Rd
- 4588 High Spring Rd
- 4585 High Spring Rd
- 4482 Tallyrand Cir
- 4622 High Spring Rd
- 4624 High Spring Rd
- 4618 High Spring Rd
- 4592 High Spring Rd
- 4614 High Spring Rd
- 4495 Tallyrand Cir
- 4587 High Spring Rd
- 4646 Starfire Cir
- 4596 High Spring Rd
- 4591 High Spring Rd
- 4672 Starfire Cir
- 4625 High Spring Rd
- 4421 Tallyrand Cir
Your Personal Tour Guide
Ask me questions while you tour the home.