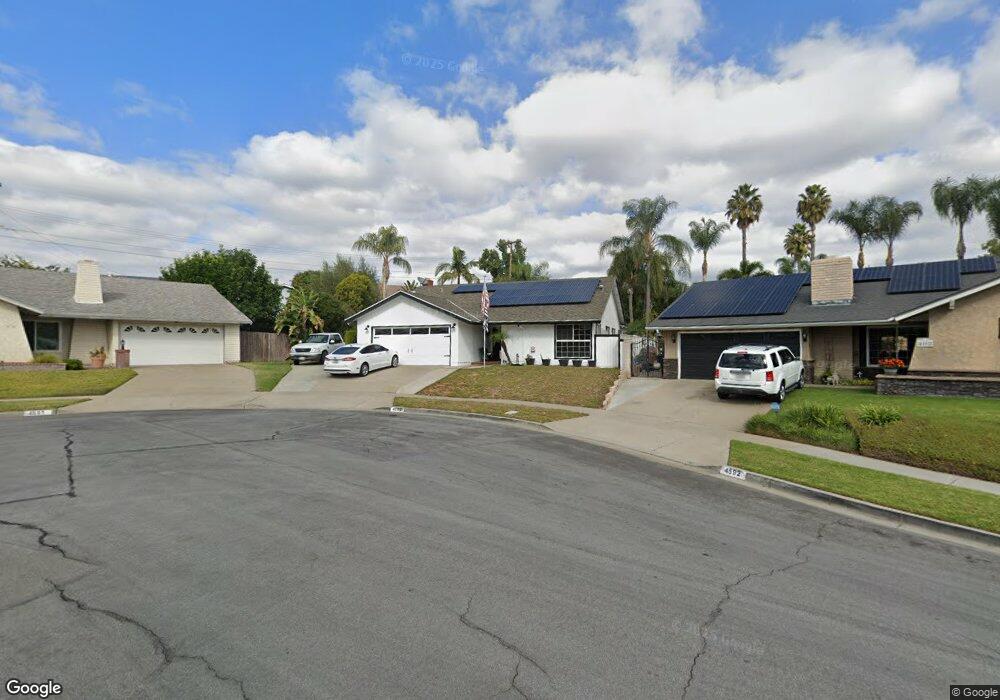
4582 Jeanean Ln Yorba Linda, CA 92886
Estimated Value: $1,101,093 - $1,254,000
4
Beds
2
Baths
1,627
Sq Ft
$711/Sq Ft
Est. Value
About This Home
This home is located at 4582 Jeanean Ln, Yorba Linda, CA 92886 and is currently estimated at $1,156,773, approximately $710 per square foot. 4582 Jeanean Ln is a home located in Orange County with nearby schools including Rose Drive Elementary, Yorba Linda Middle School, and El Dorado High School.
Ownership History
Date
Name
Owned For
Owner Type
Purchase Details
Closed on
Dec 29, 2022
Sold by
Handlon Brian A and Handlon Jo Anne
Bought by
Handlon Family Trust
Current Estimated Value
Purchase Details
Closed on
Mar 9, 2004
Sold by
Conlin Family Trust
Bought by
Handlon Brian A and Handlon Jo Anne
Home Financials for this Owner
Home Financials are based on the most recent Mortgage that was taken out on this home.
Original Mortgage
$365,000
Interest Rate
6.27%
Mortgage Type
Purchase Money Mortgage
Purchase Details
Closed on
Apr 18, 2002
Sold by
Conlin Walter W and Conlin Virginia A
Bought by
Conlin Walter W and Conlin Viginia A
Home Financials for this Owner
Home Financials are based on the most recent Mortgage that was taken out on this home.
Original Mortgage
$130,000
Interest Rate
6.87%
Purchase Details
Closed on
Aug 2, 1993
Sold by
Conlin Walter W and Conlin Virginia A
Bought by
Conlin Walter W and Conlin Virginia A
Create a Home Valuation Report for This Property
The Home Valuation Report is an in-depth analysis detailing your home's value as well as a comparison with similar homes in the area
Home Values in the Area
Average Home Value in this Area
Purchase History
| Date | Buyer | Sale Price | Title Company |
|---|---|---|---|
| Handlon Family Trust | -- | -- | |
| Handlon Brian A | $530,000 | Chicago Title Co | |
| Conlin Walter W | -- | -- | |
| Conlin Walter W | -- | -- | |
| Conlin Walter W | -- | -- |
Source: Public Records
Mortgage History
| Date | Status | Borrower | Loan Amount |
|---|---|---|---|
| Previous Owner | Handlon Brian A | $365,000 | |
| Previous Owner | Conlin Walter W | $130,000 |
Source: Public Records
Tax History Compared to Growth
Tax History
| Year | Tax Paid | Tax Assessment Tax Assessment Total Assessment is a certain percentage of the fair market value that is determined by local assessors to be the total taxable value of land and additions on the property. | Land | Improvement |
|---|---|---|---|---|
| 2025 | $8,234 | $738,769 | $623,696 | $115,073 |
| 2024 | $8,234 | $724,284 | $611,467 | $112,817 |
| 2023 | $8,086 | $710,083 | $599,478 | $110,605 |
| 2022 | $8,009 | $696,160 | $587,723 | $108,437 |
| 2021 | $7,865 | $682,510 | $576,199 | $106,311 |
| 2020 | $7,772 | $675,512 | $570,291 | $105,221 |
| 2019 | $7,495 | $662,267 | $559,109 | $103,158 |
| 2018 | $7,401 | $649,282 | $548,146 | $101,136 |
| 2017 | $7,280 | $636,551 | $537,398 | $99,153 |
| 2016 | $7,133 | $624,070 | $526,861 | $97,209 |
| 2015 | $7,046 | $614,696 | $518,947 | $95,749 |
| 2014 | $6,318 | $554,600 | $466,989 | $87,611 |
Source: Public Records
Map
Nearby Homes
- 16692 Meadowview Dr
- 11715 Rose Dr
- 943 Berkenstock Ln
- 4882 Kermath St
- 4802 Brookway Ave
- 4781 Kona Kove Way
- 4942 Gem Ln
- 1429 Prospect Ave Unit B
- 1701 Shaw Cir
- 719 Cobb Ave
- 17001 La Kenice Way
- 619 E Yorba Linda Blvd
- 1261 Desoto St
- 1837 Kelleher Place
- 792 Ottawa Dr
- 2318 Blackfoot Ave
- 16742 Lake Park Way
- 16942 Lake Park Way
- 1000 Henrietta Cir
- 16950 Lake Park Way Unit 7
- 4592 Jeanean Ln
- 4552 Mimosa Dr
- 4556 Mimosa Dr
- 4591 Loncrest Cir
- 4542 Mimosa Dr
- 16651 Huggins Ave
- 4581 Loncrest Cir
- 4562 Mimosa Dr
- 4591 Jeanean Ln
- 4601 Jeanean Ln
- 4611 Jeanean Ln
- 4611 Loncrest Cir
- 16600 Cresta Bella Cir
- 4532 Mimosa Dr
- 4621 Jeanean Ln
- 4582 Loncrest Cir
- 4572 Mimosa Dr
- 4541 Mimosa Dr
- 4551 Mimosa Dr
- 16652 Huggins Ave