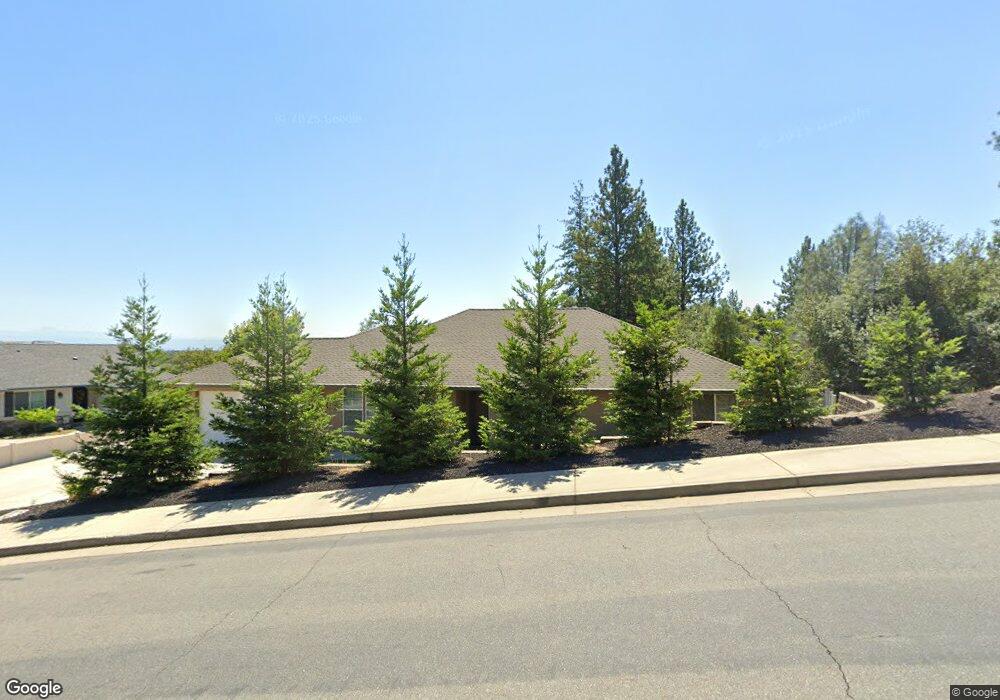
4584 Risstay Way Shasta Lake, CA 96019
Pine Grove NeighborhoodEstimated Value: $415,000 - $479,000
3
Beds
2
Baths
1,616
Sq Ft
$277/Sq Ft
Est. Value
About This Home
This home is located at 4584 Risstay Way, Shasta Lake, CA 96019 and is currently estimated at $447,323, approximately $276 per square foot. 4584 Risstay Way is a home with nearby schools including Redding STEM Academy.
Ownership History
Date
Name
Owned For
Owner Type
Purchase Details
Closed on
Aug 28, 2019
Sold by
Gunlogson Renee
Bought by
Gunlogson Mark A
Current Estimated Value
Home Financials for this Owner
Home Financials are based on the most recent Mortgage that was taken out on this home.
Original Mortgage
$961,000
Outstanding Balance
$845,183
Interest Rate
3.8%
Mortgage Type
Construction
Estimated Equity
-$397,860
Purchase Details
Closed on
Aug 21, 2019
Sold by
Holt Distressed Property Fund 2010 Lp
Bought by
Gunloggon Mark A
Home Financials for this Owner
Home Financials are based on the most recent Mortgage that was taken out on this home.
Original Mortgage
$961,000
Outstanding Balance
$845,183
Interest Rate
3.8%
Mortgage Type
Construction
Estimated Equity
-$397,860
Purchase Details
Closed on
Dec 24, 2015
Sold by
Holt Distressed Property Fund 2010 Lp
Bought by
Holt Distressed Property Fund Parallel 1
Create a Home Valuation Report for This Property
The Home Valuation Report is an in-depth analysis detailing your home's value as well as a comparison with similar homes in the area
Home Values in the Area
Average Home Value in this Area
Purchase History
| Date | Buyer | Sale Price | Title Company |
|---|---|---|---|
| Gunlogson Mark A | -- | Placer Title Company | |
| Holt Distressed Property Fund 2010 Lp | -- | Placer Title Company | |
| Gunloggon Mark A | $175,000 | Placer Title Company | |
| Holt Distressed Property Fund Parallel 1 | -- | None Available |
Source: Public Records
Mortgage History
| Date | Status | Borrower | Loan Amount |
|---|---|---|---|
| Open | Gunlogson Mark A | $961,000 |
Source: Public Records
Tax History Compared to Growth
Tax History
| Year | Tax Paid | Tax Assessment Tax Assessment Total Assessment is a certain percentage of the fair market value that is determined by local assessors to be the total taxable value of land and additions on the property. | Land | Improvement |
|---|---|---|---|---|
| 2025 | $3,885 | $332,807 | $49,212 | $283,595 |
| 2024 | $3,817 | $326,283 | $48,248 | $278,035 |
| 2023 | $3,817 | $319,886 | $47,302 | $272,584 |
| 2022 | $3,724 | $313,615 | $46,375 | $267,240 |
| 2021 | $3,679 | $307,466 | $45,466 | $262,000 |
| 2020 | $1,398 | $97,000 | $45,000 | $52,000 |
| 2019 | $637 | $31,318 | $31,318 | $0 |
| 2018 | $636 | $30,704 | $30,704 | $0 |
| 2017 | $512 | $30,102 | $30,102 | $0 |
| 2016 | $491 | $29,512 | $29,512 | $0 |
Source: Public Records
Map
Nearby Homes
- 4537 Risstay Way
- 4461 Risstay Way
- 4620 Orkney Place Unit 3
- 2866 Smith Ave
- 4433 Trinity St
- 2319 Ostling Ave
- 3097 Butterfly Ln
- 2308 Ostling Ave
- 4145 Doyle Ct
- 3202 Dartford Dr
- 5295 Pine Grove Ave
- 3257 Sioux Dr
- 4200 Pine Grove Ave
- 4399 Newbury Ct
- 3126 Chaucer Way
- 0 Avington Way
- 2141 Montana Ave
- 4465 Vallecito St
- 2495 Farm Hill Dr
- 3742 Craftsman Ave
- 4596 Risstay Way
- 0 Risstay Way Unit 7-5180
- 0 Risstay Way Unit 6-6352
- 0 Risstay Way Unit 20-4145
- 4600 Loch Place
- 4585 Risstay Way
- 4602 Risstay Way
- 4540 Risstay Way
- 4569 Risstay Way
- 4621 Loch Place
- 4610 Risstay Way
- 4553 Risstay Way
- 2796 Jorzack Way
- 4570 Risstay Way
- 4510 Risstay Way
- 2784 Jorzack Way
- 4618 Loch Place
- 4615 Risstay Way
- 4611 Orkney Place
- 4637 Loch Place