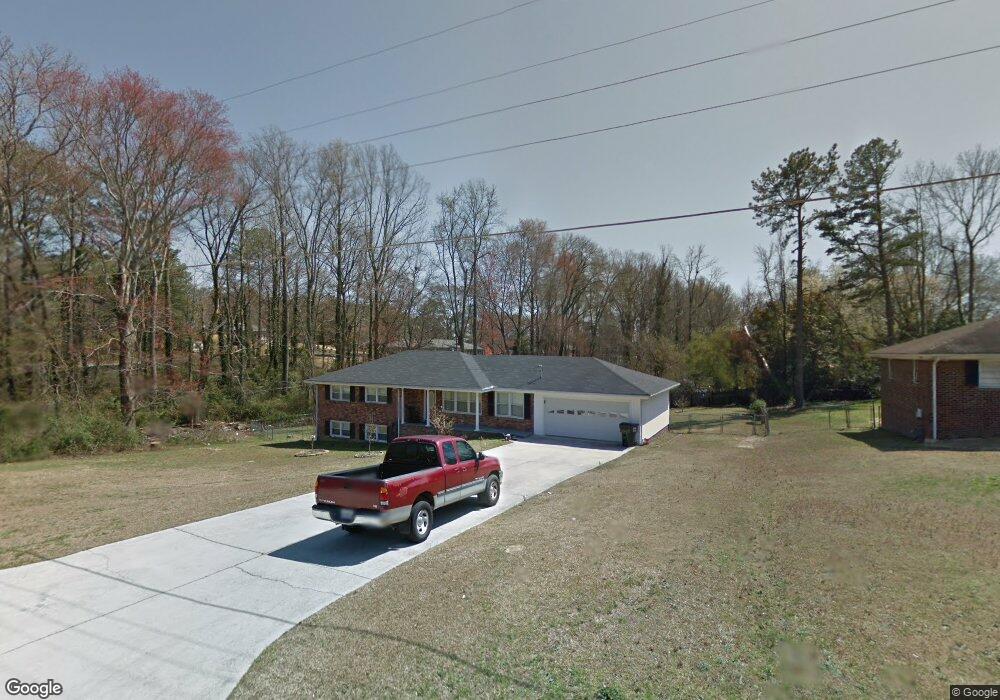
4585 Big B Rd Unit 3 Douglasville, GA 30134
Estimated Value: $222,000 - $291,000
3
Beds
3
Baths
2,850
Sq Ft
$87/Sq Ft
Est. Value
About This Home
This home is located at 4585 Big B Rd Unit 3, Douglasville, GA 30134 and is currently estimated at $249,305, approximately $87 per square foot. 4585 Big B Rd Unit 3 is a home located in Douglas County with nearby schools including Eastside Elementary School, Chestnut Log Middle School, and Lithia Springs Comprehensive High School.
Ownership History
Date
Name
Owned For
Owner Type
Purchase Details
Closed on
Mar 11, 2011
Sold by
Federal Natl Mtg Assn Fnma
Bought by
Romero Aleyda
Current Estimated Value
Home Financials for this Owner
Home Financials are based on the most recent Mortgage that was taken out on this home.
Original Mortgage
$58,378
Outstanding Balance
$41,426
Interest Rate
5.5%
Mortgage Type
FHA
Estimated Equity
$207,879
Purchase Details
Closed on
Sep 7, 2010
Sold by
Everhome Mtg Co
Bought by
Federal Natl Mtg Assn Fnma
Purchase Details
Closed on
Jun 27, 2003
Sold by
Mauldin W H
Bought by
King Joseph M
Home Financials for this Owner
Home Financials are based on the most recent Mortgage that was taken out on this home.
Original Mortgage
$155,000
Interest Rate
5.29%
Mortgage Type
New Conventional
Purchase Details
Closed on
May 5, 2000
Sold by
Fowler William R
Bought by
Mauldin W H
Create a Home Valuation Report for This Property
The Home Valuation Report is an in-depth analysis detailing your home's value as well as a comparison with similar homes in the area
Home Values in the Area
Average Home Value in this Area
Purchase History
| Date | Buyer | Sale Price | Title Company |
|---|---|---|---|
| Romero Aleyda | -- | -- | |
| Federal Natl Mtg Assn Fnma | -- | -- | |
| Everhome Mtg Co | $121,047 | -- | |
| King Joseph M | $155,000 | -- | |
| Mauldin W H | $84,300 | -- |
Source: Public Records
Mortgage History
| Date | Status | Borrower | Loan Amount |
|---|---|---|---|
| Open | Romero Aleyda | $58,378 | |
| Previous Owner | King Joseph M | $155,000 |
Source: Public Records
Tax History Compared to Growth
Tax History
| Year | Tax Paid | Tax Assessment Tax Assessment Total Assessment is a certain percentage of the fair market value that is determined by local assessors to be the total taxable value of land and additions on the property. | Land | Improvement |
|---|---|---|---|---|
| 2024 | $2,634 | $107,520 | $21,000 | $86,520 |
| 2023 | $2,634 | $107,520 | $21,000 | $86,520 |
| 2022 | $2,002 | $71,520 | $15,120 | $56,400 |
| 2021 | $1,703 | $56,440 | $11,120 | $45,320 |
| 2020 | $1,734 | $56,440 | $11,120 | $45,320 |
| 2019 | $1,691 | $54,600 | $11,120 | $43,480 |
| 2018 | $1,446 | $46,480 | $9,640 | $36,840 |
| 2017 | $1,321 | $41,640 | $9,640 | $32,000 |
| 2016 | $1,029 | $31,880 | $7,560 | $24,320 |
| 2015 | $1,113 | $33,760 | $8,320 | $25,440 |
| 2014 | $1,170 | $34,820 | $8,840 | $25,980 |
| 2013 | -- | $40,560 | $10,400 | $30,160 |
Source: Public Records
Map
Nearby Homes
- 8108 Fieldstream Way
- 4370 Clearview Dr
- 5823 Fairburn Rd
- 4450 Wood Hollow Ct
- 4311 Short St
- 4385 Midway Rd
- 4229 Clearview Dr
- 4239 Midway Dr
- 6294 Belmont Park Dr
- 4229 Midway Dr
- 1520 Oxford St
- 5008 Elowen Ln
- 6248 Ellis St
- 6253 Hospital Way
- 8501 Westchester Dr
- 3948 Regent St
- Triton Plan at Chestnut Grove
- Cosmos Plan at Chestnut Grove
- Echo Plan at Chestnut Grove
- 2026 Ayla Dr
- 4585 Big B Rd
- 4597 Big B Rd Unit 3
- 4571 Big B Rd
- 1820 Sandy Ln
- 1821 Crabapple Ln
- 4586 Big B Rd
- 4596 Big B Rd
- 4611 Big B Rd
- 4576 Big B Rd
- 4576 Big B Rd Unit 3
- 4555 Big B Rd
- 1840 Sandy Ln
- 1845 Sandy Ln
- 4610 Big B Rd
- 4566 Big B Rd
- 1855 Sandy Ln
- 4627 Big B Rd
- 1820 Crabapple Ln Unit 44
- 1820 Crabapple Ln
- 1841 Crabapple Ln