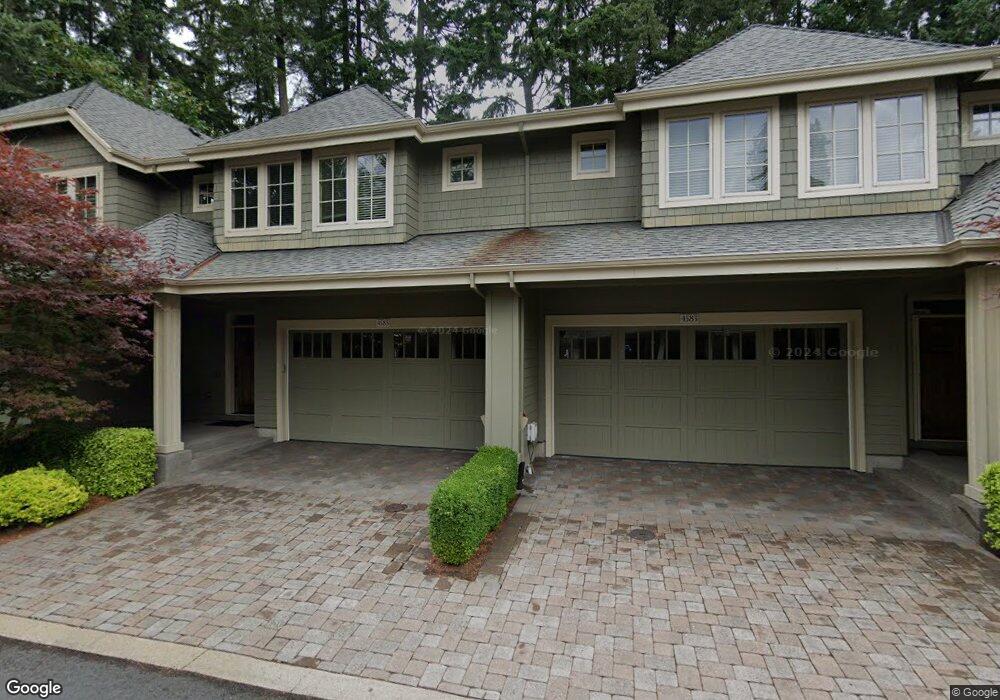
4585 Trillium Woods Unit Lot12 Lake Oswego, OR 97035
Waluga NeighborhoodEstimated Value: $819,209 - $1,119,000
3
Beds
3
Baths
2,004
Sq Ft
$462/Sq Ft
Est. Value
About This Home
This home is located at 4585 Trillium Woods Unit Lot12, Lake Oswego, OR 97035 and is currently estimated at $925,552, approximately $461 per square foot. 4585 Trillium Woods Unit Lot12 is a home located in Clackamas County with nearby schools including Lake Grove Elementary School, Lake Oswego Junior High School, and Lake Oswego Senior High School.
Ownership History
Date
Name
Owned For
Owner Type
Purchase Details
Closed on
Sep 12, 2017
Sold by
Guletsky Jo Ann and Guletsky Alexander W
Bought by
Gerstner Alexander Paul
Current Estimated Value
Home Financials for this Owner
Home Financials are based on the most recent Mortgage that was taken out on this home.
Original Mortgage
$424,100
Outstanding Balance
$353,304
Interest Rate
3.9%
Mortgage Type
New Conventional
Estimated Equity
$572,248
Purchase Details
Closed on
Mar 30, 2017
Sold by
Lorderhose Peter
Bought by
Guletsky Alexander and Guletsky Jo Ann
Purchase Details
Closed on
Apr 10, 2012
Sold by
Chesapeake Holdings Trillium Llc
Bought by
Loderhose Peter
Home Financials for this Owner
Home Financials are based on the most recent Mortgage that was taken out on this home.
Original Mortgage
$369,043
Interest Rate
4.4%
Mortgage Type
FHA
Create a Home Valuation Report for This Property
The Home Valuation Report is an in-depth analysis detailing your home's value as well as a comparison with similar homes in the area
Home Values in the Area
Average Home Value in this Area
Purchase History
| Date | Buyer | Sale Price | Title Company |
|---|---|---|---|
| Gerstner Alexander Paul | $620,000 | Wfg Title | |
| Guletsky Alexander | $587,500 | Wfg Title | |
| Loderhose Peter | $405,990 | First American |
Source: Public Records
Mortgage History
| Date | Status | Borrower | Loan Amount |
|---|---|---|---|
| Open | Gerstner Alexander Paul | $424,100 | |
| Previous Owner | Loderhose Peter | $369,043 |
Source: Public Records
Tax History Compared to Growth
Tax History
| Year | Tax Paid | Tax Assessment Tax Assessment Total Assessment is a certain percentage of the fair market value that is determined by local assessors to be the total taxable value of land and additions on the property. | Land | Improvement |
|---|---|---|---|---|
| 2025 | $9,921 | $516,630 | -- | -- |
| 2024 | $9,657 | $501,583 | -- | -- |
| 2023 | $9,657 | $486,974 | $0 | $0 |
| 2022 | $9,095 | $472,791 | $0 | $0 |
| 2021 | $8,400 | $459,021 | $0 | $0 |
| 2020 | $8,189 | $445,652 | $0 | $0 |
| 2019 | $7,988 | $432,672 | $0 | $0 |
| 2018 | $7,596 | $420,070 | $0 | $0 |
| 2017 | $7,330 | $407,835 | $0 | $0 |
| 2016 | $6,673 | $395,956 | $0 | $0 |
| 2015 | $6,447 | $384,423 | $0 | $0 |
| 2014 | $6,363 | $373,226 | $0 | $0 |
Source: Public Records
Map
Nearby Homes
- 4520 Trillium Woods
- 4521 Trillium Woods
- 4284 Oakridge Rd
- 16061 Waluga Dr
- 4225 Oakridge Rd
- 4974 Park Bluff Place
- 4992 Park Bluff Place
- 5010 Park Bluff Place
- 15601 Manchester Dr
- 5037 Parkhill St
- 4480 Upper Dr
- 3884 Lake Grove Ave
- 3850 Lake Grove Ave
- 5057 W Sunset Dr
- 5363 Greystoke Dr
- 4368 Lakeview Blvd
- 3730 Upper Dr
- 4610 Lower Dr
- 5185 Carman Dr
- 4470 Lakeview Blvd
- 4585 Trillium Woods
- 4587 Trillium Woods Unit Lot11
- 4583 Trillium Woods
- 0 Nda Required Unit 18178075
- 4581 Trillium Woods
- 0 E Rivergrove Woods Lot 16 Unit 670614
- Lot 2 Rivergrove Woods
- Lot 3 Rivergrove Woods
- Lot 6 Rivergrove Woods
- 0 E Rivergrove Woods Lot 18 Unit 670449
- 81 Pheryl
- 17780 Do Not Call
- 4621
- 14412 Sherbrook-Not Moving
- 19255 SW 65th Ave Suite 200 Unit 2
- 7525 Sestan
- 7 Adamsrelisted
- 13369 Relisted#224747
- 13050 Relisted
- 73 See New Ml# 200315