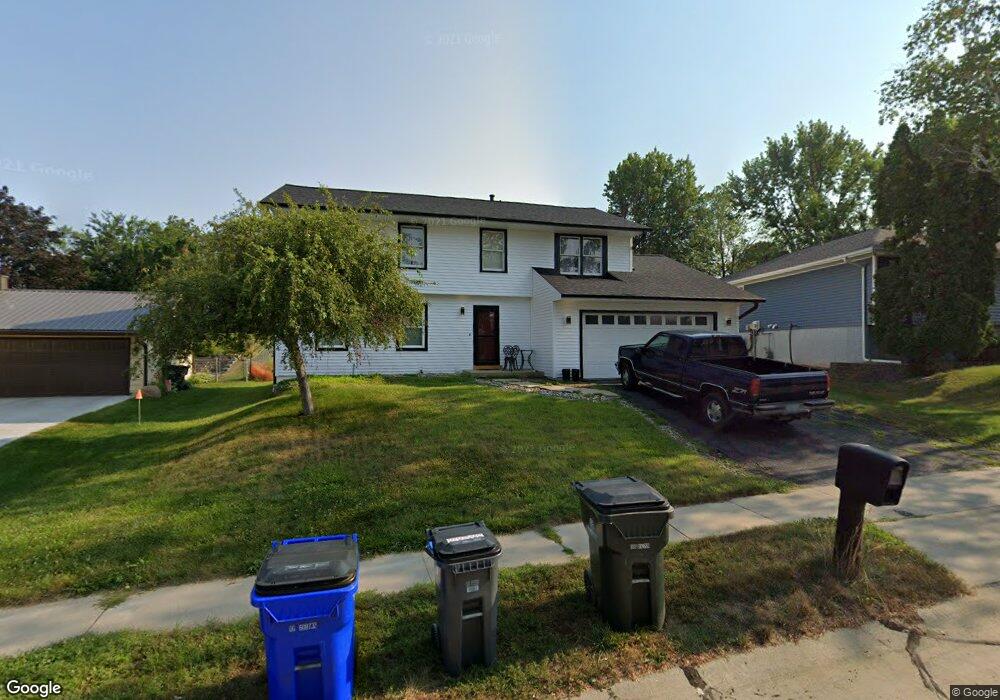
4588 Jonathan Ln NW Cedar Rapids, IA 52405
Cherry Hill Park NeighborhoodEstimated Value: $267,339 - $288,000
4
Beds
3
Baths
1,972
Sq Ft
$140/Sq Ft
Est. Value
About This Home
This home is located at 4588 Jonathan Ln NW, Cedar Rapids, IA 52405 and is currently estimated at $275,335, approximately $139 per square foot. 4588 Jonathan Ln NW is a home located in Linn County with nearby schools including Junction City Elementary School, North Middletown Elementary School, and Truman Elementary School.
Ownership History
Date
Name
Owned For
Owner Type
Purchase Details
Closed on
Jul 2, 2014
Sold by
Lansdown Brett J and Lansdown Gina C
Bought by
Anderson Christopher D
Current Estimated Value
Home Financials for this Owner
Home Financials are based on the most recent Mortgage that was taken out on this home.
Original Mortgage
$170,356
Outstanding Balance
$129,614
Interest Rate
4.13%
Mortgage Type
FHA
Estimated Equity
$145,721
Purchase Details
Closed on
May 1, 2008
Sold by
Tanner Kevin S and Tanner Shannon M
Bought by
Lansdown Brett J and Lansdown Gina C
Home Financials for this Owner
Home Financials are based on the most recent Mortgage that was taken out on this home.
Original Mortgage
$165,737
Interest Rate
5.88%
Mortgage Type
FHA
Purchase Details
Closed on
Jan 25, 2000
Sold by
Blase John J and Blase Karen S
Bought by
Tanner Kevin S and Tanner Shannon M
Home Financials for this Owner
Home Financials are based on the most recent Mortgage that was taken out on this home.
Original Mortgage
$105,200
Interest Rate
7.84%
Create a Home Valuation Report for This Property
The Home Valuation Report is an in-depth analysis detailing your home's value as well as a comparison with similar homes in the area
Home Values in the Area
Average Home Value in this Area
Purchase History
| Date | Buyer | Sale Price | Title Company |
|---|---|---|---|
| Anderson Christopher D | $173,500 | None Available | |
| Lansdown Brett J | $167,000 | None Available | |
| Tanner Kevin S | $131,000 | -- |
Source: Public Records
Mortgage History
| Date | Status | Borrower | Loan Amount |
|---|---|---|---|
| Open | Anderson Christopher D | $170,356 | |
| Previous Owner | Lansdown Brett J | $165,737 | |
| Previous Owner | Tanner Kevin S | $105,200 |
Source: Public Records
Tax History Compared to Growth
Tax History
| Year | Tax Paid | Tax Assessment Tax Assessment Total Assessment is a certain percentage of the fair market value that is determined by local assessors to be the total taxable value of land and additions on the property. | Land | Improvement |
|---|---|---|---|---|
| 2025 | $3,946 | $241,100 | $44,700 | $196,400 |
| 2024 | $3,854 | $232,300 | $44,700 | $187,600 |
| 2023 | $3,854 | $223,000 | $41,300 | $181,700 |
| 2022 | $3,784 | $182,700 | $37,800 | $144,900 |
| 2021 | $4,070 | $182,700 | $37,800 | $144,900 |
| 2020 | $4,070 | $184,500 | $34,400 | $150,100 |
| 2019 | $3,800 | $176,300 | $31,000 | $145,300 |
| 2018 | $3,696 | $176,300 | $31,000 | $145,300 |
| 2017 | $3,596 | $169,200 | $31,000 | $138,200 |
| 2016 | $3,596 | $169,200 | $31,000 | $138,200 |
| 2015 | $3,489 | $164,020 | $30,965 | $133,055 |
| 2014 | $3,304 | $164,020 | $30,965 | $133,055 |
| 2013 | $3,230 | $164,020 | $30,965 | $133,055 |
Source: Public Records
Map
Nearby Homes
- 4819 Fruitwood Ln NW
- 4819 Ford Ave NW
- 272 Peace Ave NW
- 281 Jacolyn Dr NW
- 208 Lenora Dr NW
- 229 Jacolyn Dr NW
- 4975 Kesler Rd NW
- 4910 Gordon Ave NW
- 3507 E Ave NW Unit F
- 3509 E Ave NW Unit D
- 3600 Midway Dr NW
- 5127 Holly Ave NW
- 1608 Morris Ave NW
- 3312 G Ave NW
- 1410 Adair Ct SW Unit Lot 2
- 3313 Crestwood Dr NW
- 1722 Gardner Dr NW
- 327 NW Edgewood Rd Unit 324, 330, 336, 342 C
- 150 Meadowlark Ln NW
- 56 Julia Ann Dr NW
- 4594 Jonathan Ln NW
- 4582 Jonathan Ln NW
- 4585 Orchard Dr NW
- 711 Olive Dr NW
- 4571 Orchard Dr NW
- 4600 Jonathan Ln NW
- 4576 Jonathan Ln NW
- 4570 Jonathan Ln NW
- 721 Olive Dr NW
- 4565 Orchard Dr NW
- 4591 Jonathan Ln NW
- 4603 Jonathan Ln NW
- 4597 Orchard Dr NW
- 4597 Jonathan Ln NW
- 4585 Jonathan Ln NW
- 731 Olive Dr NW
- 4609 Jonathan Ln NW
- 4603 Orchard Dr NW
- 4571 Jonathan Ln NW
- 637 Olive Dr NW