Estimated Value: $283,230
Studio
--
Bath
3,740
Sq Ft
$76/Sq Ft
Est. Value
About This Home
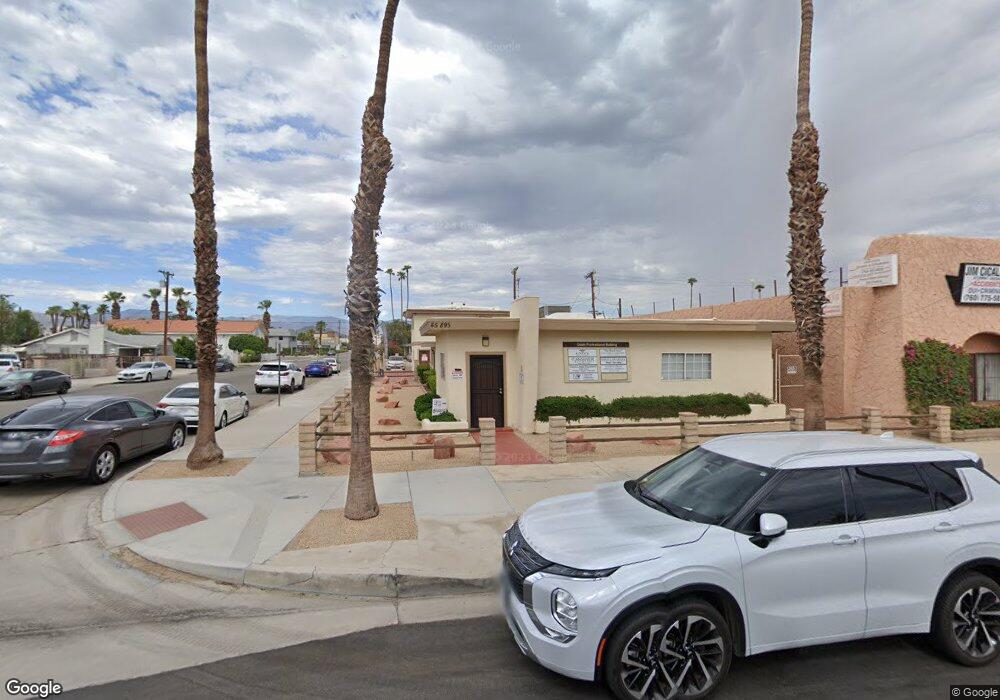
This home is located at 45895 Oasis St, Indio, CA 92201 and is currently estimated at $283,230, approximately $75 per square foot. 45895 Oasis St is a home located in Riverside County with nearby schools including Theodore Roosevelt Elementary School, Thomas Jefferson Middle School, and Indio High School.
Ownership History
Date
Name
Owned For
Owner Type
Purchase Details
Closed on
Aug 23, 2002
Sold by
Quinlan Daniel J
Bought by
Quinlan Daniel J
Current Estimated Value
Purchase Details
Closed on
Jun 24, 1998
Sold by
Fsla Hemet
Bought by
Quinlan Daniel J
Home Financials for this Owner
Home Financials are based on the most recent Mortgage that was taken out on this home.
Original Mortgage
$62,500
Interest Rate
6.93%
Mortgage Type
Commercial
Purchase Details
Closed on
Nov 20, 1997
Sold by
Lawson Robert C and Lawson Wendy S
Bought by
Fsla Hemet
Purchase Details
Closed on
Oct 13, 1993
Sold by
Lawson Wendy S
Bought by
Randazzo Henry and Randazzo Mary Christine
Home Financials for this Owner
Home Financials are based on the most recent Mortgage that was taken out on this home.
Original Mortgage
$108,078
Interest Rate
6.89%
Mortgage Type
Seller Take Back
Create a Home Valuation Report for This Property
The Home Valuation Report is an in-depth analysis detailing your home's value as well as a comparison with similar homes in the area
Home Values in the Area
Average Home Value in this Area
Purchase History
| Date | Buyer | Sale Price | Title Company |
|---|---|---|---|
| Quinlan Daniel J | -- | -- | |
| Quinlan Daniel J | $65,000 | Commonwealth Land Title Co | |
| Fsla Hemet | $129,821 | Lawyers Title Company | |
| Randazzo Henry | $79,000 | First American Title Ins Co |
Source: Public Records
Mortgage History
| Date | Status | Borrower | Loan Amount |
|---|---|---|---|
| Previous Owner | Quinlan Daniel J | $62,500 | |
| Previous Owner | Randazzo Henry | $108,078 |
Source: Public Records
Tax History
| Year | Tax Paid | Tax Assessment Tax Assessment Total Assessment is a certain percentage of the fair market value that is determined by local assessors to be the total taxable value of land and additions on the property. | Land | Improvement |
|---|---|---|---|---|
| 2025 | $4,178 | $154,609 | $47,016 | $107,593 |
| 2023 | $4,178 | $148,608 | $45,192 | $103,416 |
| 2022 | $3,843 | $145,695 | $44,306 | $101,389 |
| 2021 | $3,430 | $142,839 | $43,438 | $99,401 |
| 2020 | $3,965 | $141,375 | $42,993 | $98,382 |
| 2019 | $3,814 | $138,603 | $42,150 | $96,453 |
| 2018 | $3,742 | $135,886 | $41,324 | $94,562 |
| 2017 | $3,707 | $133,222 | $40,514 | $92,708 |
| 2016 | $3,500 | $130,611 | $39,720 | $90,891 |
| 2015 | $3,290 | $128,651 | $39,124 | $89,527 |
| 2014 | $3,258 | $126,132 | $38,358 | $87,774 |
Source: Public Records
Map
Nearby Homes
- 1 Oasis St
- 82625 Requa Ave
- 45671 Deglet Noor St
- 12345 Jackson St
- 82451 John Nobles Ave
- 46581 Denslow St
- 82237 Bliss Ave
- 0 Palm St
- 46440 Doctor Carreon Blvd
- 83734 Doctor Carreon Blvd
- 44725 Palm St
- 82489 Valencia Ave
- 82950 California 111
- 0 Monroe St Unit 219141652PS
- 82211 Garden Ave
- 82432 Deborah Dr
- 83335 Avenue 45
- 82180 Valencia Ave
- 82474 Priscilla Ct
- 47254 Diane St
- 45895 Oasis St Unit D
- 45895 Oasis St Unit J
- 45895 Oasis St Unit A&B
- 45895 Oasis St Unit K
- 00 Oasis St
- 45880 King St
- 45860 King St
- 82673 Saidy Ave
- 45840 King St
- 45902 Oasis St Unit Suite B
- 45902 Oasis St Unit A
- 45902 Oasis St
- 45820 King St
- 45786 King St
- 45733 Oasis St
- 82710 California 111
- 45750 King St
- 45879 Towne St
- 45785 Towne St
- 45740 King St
Your Personal Tour Guide
Ask me questions while you tour the home.