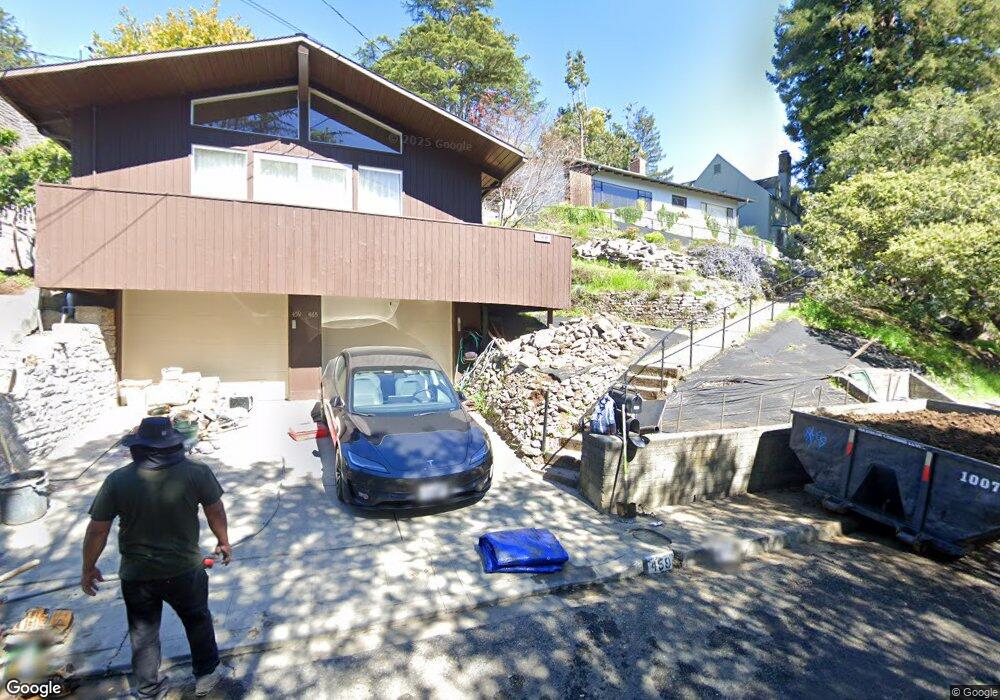
459 Boynton Ave Berkeley, CA 94707
Estimated Value: $1,810,000 - $2,147,897
4
Beds
3
Baths
2,059
Sq Ft
$970/Sq Ft
Est. Value
About This Home
This home is located at 459 Boynton Ave, Berkeley, CA 94707 and is currently estimated at $1,997,966, approximately $970 per square foot. 459 Boynton Ave is a home located in Alameda County with nearby schools including Thousand Oaks Elementary School, Berkeley Arts Magnet at Whittier School, and Ruth Acty Elementary.
Ownership History
Date
Name
Owned For
Owner Type
Purchase Details
Closed on
Nov 3, 2020
Sold by
Beauchamp Robin G and Beauchamp Susan M
Bought by
Beauchamp Robin G and Beauchamp Susan M
Current Estimated Value
Home Financials for this Owner
Home Financials are based on the most recent Mortgage that was taken out on this home.
Original Mortgage
$494,000
Outstanding Balance
$438,586
Interest Rate
2.8%
Mortgage Type
New Conventional
Estimated Equity
$1,559,380
Purchase Details
Closed on
Nov 14, 2001
Sold by
Draper Wendy E and Burnham Dale Caroline
Bought by
Beauchamp Robin and Beauchamp Susan M
Home Financials for this Owner
Home Financials are based on the most recent Mortgage that was taken out on this home.
Original Mortgage
$495,000
Interest Rate
6.63%
Mortgage Type
Commercial
Create a Home Valuation Report for This Property
The Home Valuation Report is an in-depth analysis detailing your home's value as well as a comparison with similar homes in the area
Home Values in the Area
Average Home Value in this Area
Purchase History
| Date | Buyer | Sale Price | Title Company |
|---|---|---|---|
| Beauchamp Robin G | -- | Chicago Title Company | |
| Beauchamp Robin C | -- | Chicago Title Company | |
| Beauchamp Robin | $725,000 | Placer Title Company |
Source: Public Records
Mortgage History
| Date | Status | Borrower | Loan Amount |
|---|---|---|---|
| Open | Beauchamp Robin C | $494,000 | |
| Closed | Beauchamp Robin | $495,000 |
Source: Public Records
Tax History
| Year | Tax Paid | Tax Assessment Tax Assessment Total Assessment is a certain percentage of the fair market value that is determined by local assessors to be the total taxable value of land and additions on the property. | Land | Improvement |
|---|---|---|---|---|
| 2025 | $16,646 | $1,063,970 | $321,291 | $749,679 |
| 2024 | $16,646 | $1,042,973 | $314,992 | $734,981 |
| 2023 | $16,281 | $1,029,390 | $308,817 | $720,573 |
| 2022 | $15,971 | $1,002,207 | $302,762 | $706,445 |
| 2021 | $15,994 | $982,421 | $296,826 | $692,595 |
| 2020 | $15,150 | $979,278 | $293,783 | $685,495 |
| 2019 | $14,563 | $960,080 | $288,024 | $672,056 |
| 2018 | $14,307 | $941,260 | $282,378 | $658,882 |
| 2017 | $13,784 | $922,808 | $276,842 | $645,966 |
| 2016 | $13,349 | $904,720 | $271,416 | $633,304 |
| 2015 | $13,166 | $891,133 | $267,340 | $623,793 |
| 2014 | $13,026 | $873,682 | $262,104 | $611,578 |
Source: Public Records
Map
Nearby Homes
- 450 Vermont Ave
- 483 Boynton Ave
- 380 Vermont Ave
- 589 San Luis Rd
- 470 Spruce St
- 410 Grizzly Peak Blvd
- 255 Stanford Ave
- 614 Cragmont Ave
- 290 Colgate Ave
- 249 Trinity Ave
- 543 Grizzly Peak Blvd
- 201 Amherst Ave
- 765 San Diego Rd
- 606 Grizzly Peak Blvd
- 1983 Yosemite Rd
- 491 Vincente Ave
- 758 Spruce St
- 260 Grizzly Peak Blvd
- 777 Cragmont Ave
- 813 San Diego Rd
- 465 Boynton Ave
- 455 Boynton Ave
- 475 Boynton Ave
- 446 Vermont Ave
- 453 Boynton Ave
- 438 Vermont Ave
- 460 Boynton Ave
- 464 Boynton Ave
- 456 Boynton Ave
- 449 Boynton Ave
- 430 Vermont Ave
- 452 Boynton Ave
- 474 Boynton Ave
- 456 Vermont Ave
- 479 Boynton Ave
- 450 Boynton Ave
- 445 Boynton Ave
- 424 Vermont Ave
- 460 Vermont Ave
- 523 Santa Barbara Rd
Your Personal Tour Guide
Ask me questions while you tour the home.