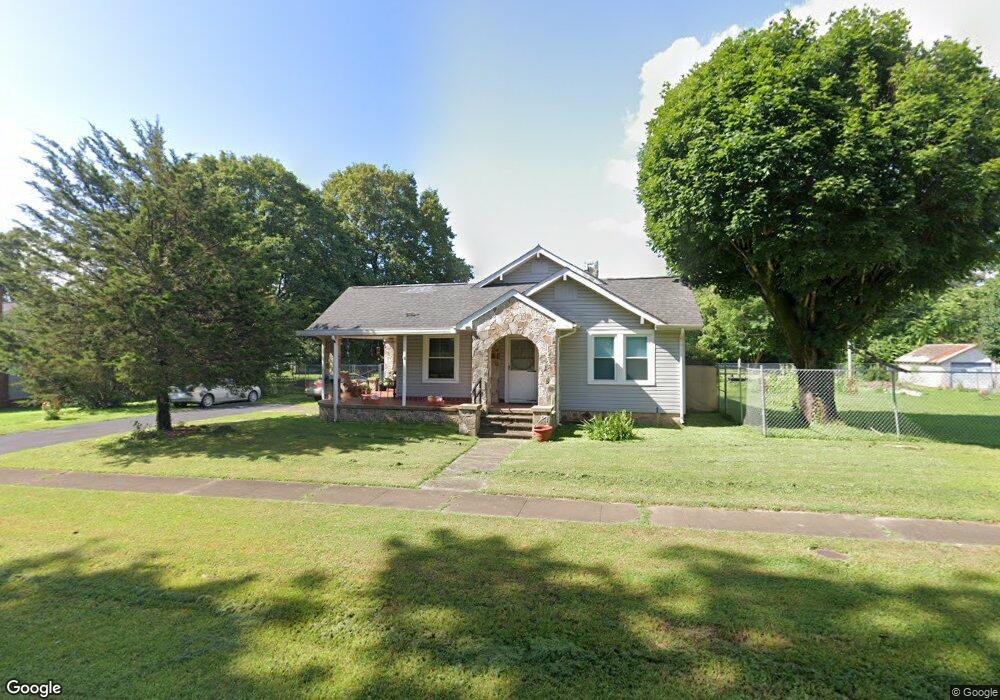
459 Cherry St Dunlap, TN 37327
Estimated Value: $172,192 - $205,000
Studio
1
Bath
859
Sq Ft
$221/Sq Ft
Est. Value
About This Home
This home is located at 459 Cherry St, Dunlap, TN 37327 and is currently estimated at $190,048, approximately $221 per square foot. 459 Cherry St is a home located in Sequatchie County with nearby schools including Griffith Elementary School, Sequatchie County Middle School, and Sequatchie County High School.
Ownership History
Date
Name
Owned For
Owner Type
Purchase Details
Closed on
Mar 22, 2019
Sold by
Ruth Mary and Dunleavy Ewton
Bought by
Mann Christopher and Mann Denisea
Current Estimated Value
Home Financials for this Owner
Home Financials are based on the most recent Mortgage that was taken out on this home.
Original Mortgage
$127,000
Outstanding Balance
$113,686
Interest Rate
4.4%
Mortgage Type
USDA
Estimated Equity
$76,362
Purchase Details
Closed on
Jun 3, 2016
Sold by
Ewton Daniel
Bought by
Dunleavy Mary Ruth Ewton
Purchase Details
Closed on
May 5, 2000
Sold by
Davenport Greely W
Bought by
Daniel Ewton and Daniel Gail
Purchase Details
Closed on
Jan 1, 1981
Create a Home Valuation Report for This Property
The Home Valuation Report is an in-depth analysis detailing your home's value as well as a comparison with similar homes in the area
Home Values in the Area
Average Home Value in this Area
Purchase History
| Date | Buyer | Sale Price | Title Company |
|---|---|---|---|
| Mann Christopher | $127,000 | None Available | |
| Dunleavy Mary Ruth Ewton | $75,000 | -- | |
| Daniel Ewton | $68,000 | -- | |
| -- | $5,000 | -- |
Source: Public Records
Mortgage History
| Date | Status | Borrower | Loan Amount |
|---|---|---|---|
| Open | Mann Christopher | $127,000 |
Source: Public Records
Tax History
| Year | Tax Paid | Tax Assessment Tax Assessment Total Assessment is a certain percentage of the fair market value that is determined by local assessors to be the total taxable value of land and additions on the property. | Land | Improvement |
|---|---|---|---|---|
| 2025 | $1,015 | $42,050 | $5,625 | $36,425 |
| 2024 | $1,015 | $42,050 | $5,625 | $36,425 |
| 2023 | $1,015 | $42,050 | $5,625 | $36,425 |
| 2022 | $867 | $26,125 | $4,600 | $21,525 |
| 2021 | $854 | $26,125 | $4,600 | $21,525 |
| 2020 | $661 | $26,125 | $4,600 | $21,525 |
| 2019 | $648 | $19,800 | $4,600 | $15,200 |
| 2018 | $640 | $19,800 | $4,600 | $15,200 |
| 2017 | $633 | $19,800 | $4,600 | $15,200 |
| 2016 | $702 | $21,075 | $4,600 | $16,475 |
| 2015 | $702 | $21,075 | $4,600 | $16,475 |
| 2014 | $702 | $21,075 | $4,600 | $16,475 |
Source: Public Records
Map
Nearby Homes
- 410 Cherry St
- 95 Blue Sky Rd Rd
- 254 Cdl Trail
- 0 SE US Hwy 127 Unit 1519993
- 0 SE US Hwy 127 Unit 1519990
- 0 SE US Hwy 127 Unit 1519988
- 0 SE US Hwy 127 Unit 1314389
- 0 SE US Hwy 127 Unit 1519979
- 0 SE US Hwy 127 Unit 1519991
- 0 SE US Hwy 127 Unit 1519984
- 21550 U S 127
- 21552 U S 127
- 0 Jericho Rd Unit 1523837
- 0 Jericho Rd Unit Lot 11
- 0 Jericho Lot 14 Rd
- 0 State Rt 399 Lot 13
- Lot 13 B Greenfields Way
- 407 Standifer Cir
- 0 Buddy Skyles Tract 1 Rd
- 95 A Main St
Your Personal Tour Guide
Ask me questions while you tour the home.