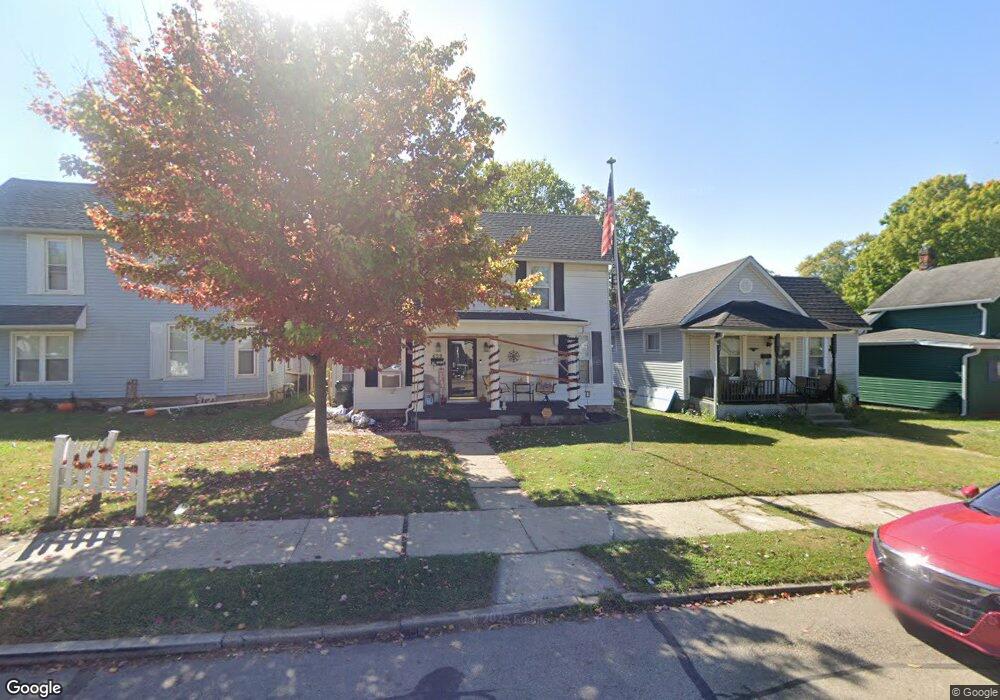
459 E Ward St Urbana, OH 43078
Estimated Value: $139,000 - $211,000
2
Beds
2
Baths
1,714
Sq Ft
$106/Sq Ft
Est. Value
About This Home
This home is located at 459 E Ward St, Urbana, OH 43078 and is currently estimated at $181,172, approximately $105 per square foot. 459 E Ward St is a home located in Champaign County with nearby schools including Urbana Elementary School, Urbana Junior High School, and Urbana High School.
Ownership History
Date
Name
Owned For
Owner Type
Purchase Details
Closed on
Jul 13, 2006
Sold by
Freyhof Marilyn M and Freyhof Richard
Bought by
Acord Joe and Acord Cindy
Current Estimated Value
Home Financials for this Owner
Home Financials are based on the most recent Mortgage that was taken out on this home.
Original Mortgage
$60,600
Outstanding Balance
$42,634
Interest Rate
10.99%
Mortgage Type
Purchase Money Mortgage
Estimated Equity
$138,538
Purchase Details
Closed on
Mar 8, 2004
Sold by
Nash David William and Nash Marcia Jean
Bought by
Freyhof Marilyn M
Home Financials for this Owner
Home Financials are based on the most recent Mortgage that was taken out on this home.
Original Mortgage
$32,700
Interest Rate
7%
Mortgage Type
Seller Take Back
Purchase Details
Closed on
Mar 5, 2004
Sold by
Freyhof Marilyn M and Freyhof Richard H
Home Financials for this Owner
Home Financials are based on the most recent Mortgage that was taken out on this home.
Original Mortgage
$32,700
Interest Rate
7%
Mortgage Type
Seller Take Back
Create a Home Valuation Report for This Property
The Home Valuation Report is an in-depth analysis detailing your home's value as well as a comparison with similar homes in the area
Home Values in the Area
Average Home Value in this Area
Purchase History
| Date | Buyer | Sale Price | Title Company |
|---|---|---|---|
| Acord Joe | $33,700 | None Available | |
| Freyhof Marilyn M | $32,500 | -- | |
| -- | $33,700 | -- |
Source: Public Records
Mortgage History
| Date | Status | Borrower | Loan Amount |
|---|---|---|---|
| Open | Acord Joe | $60,600 | |
| Previous Owner | -- | $32,700 |
Source: Public Records
Tax History
| Year | Tax Paid | Tax Assessment Tax Assessment Total Assessment is a certain percentage of the fair market value that is determined by local assessors to be the total taxable value of land and additions on the property. | Land | Improvement |
|---|---|---|---|---|
| 2025 | $1,793 | $51,560 | $5,590 | $45,970 |
| 2024 | $1,793 | $39,480 | $5,110 | $34,370 |
| 2023 | $1,660 | $39,480 | $5,110 | $34,370 |
| 2022 | $1,693 | $39,480 | $5,110 | $34,370 |
| 2021 | $1,588 | $32,800 | $4,070 | $28,730 |
| 2020 | $1,588 | $32,800 | $4,070 | $28,730 |
| 2019 | $1,569 | $32,800 | $4,070 | $28,730 |
| 2018 | $1,216 | $24,290 | $3,190 | $21,100 |
| 2017 | $1,208 | $24,290 | $3,190 | $21,100 |
| 2016 | $1,211 | $24,290 | $3,190 | $21,100 |
| 2015 | $1,199 | $23,340 | $3,190 | $20,150 |
| 2014 | $1,200 | $23,340 | $3,190 | $20,150 |
| 2013 | $1,026 | $23,340 | $3,190 | $20,150 |
Source: Public Records
Map
Nearby Homes
- 310 Washington Ave
- 310 Washington Ave Unit 310-310 1/2
- 596 Scioto St
- 344 E Market St
- 123 Washington Ave
- 217 Lincoln Place
- 204 Lafayette Ave
- 235 Boyce St
- 501 E Light St
- 110 Lincoln Place
- 427 N Walnut St
- 127 Miami St
- 322 Laurel Oak St
- 242 Laurel Oak St
- 544 Bloomfield Ave
- 417 N Russell St
- 328 W Church St
- 328 W Church St Unit 328-330
- 419 S Walnut St
- 414 Louden St Unit 416
Your Personal Tour Guide
Ask me questions while you tour the home.