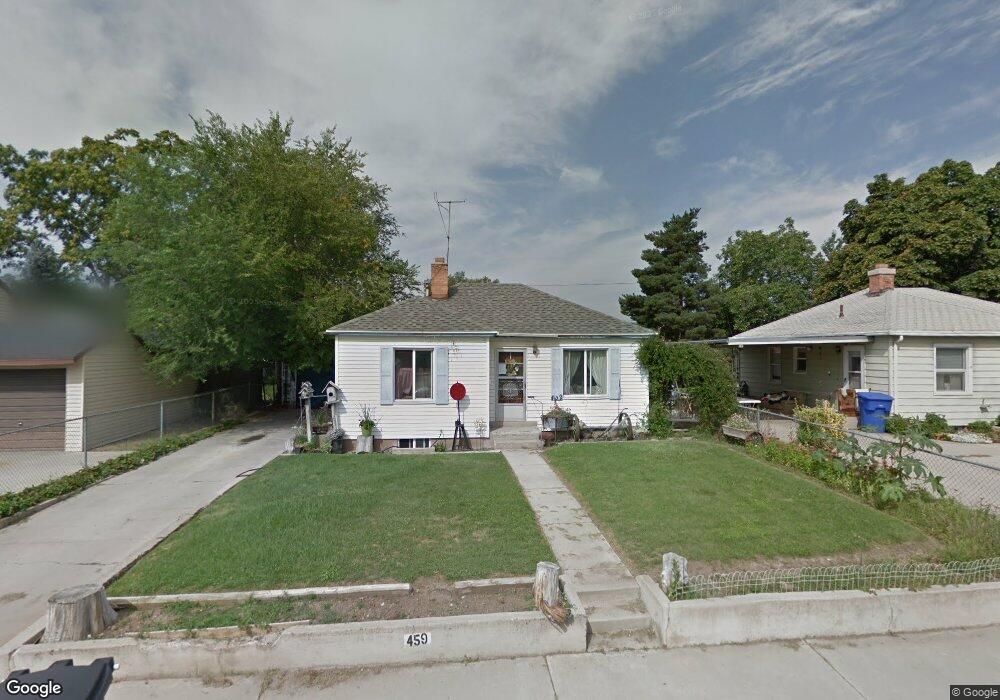
459 Emery Ave Orem, UT 84057
Geneva NeighborhoodEstimated Value: $368,000 - $387,000
2
Beds
1
Bath
732
Sq Ft
$516/Sq Ft
Est. Value
About This Home
This home is located at 459 Emery Ave, Orem, UT 84057 and is currently estimated at $377,360, approximately $515 per square foot. 459 Emery Ave is a home located in Utah County with nearby schools including Orem Junior High School, Timpanogos High School, and Noah Webster Academy.
Ownership History
Date
Name
Owned For
Owner Type
Purchase Details
Closed on
Jan 15, 2016
Sold by
Throckmorton Harold Eugene
Bought by
Throckmorton Harold Eugene and Throckmorton Joellen
Current Estimated Value
Purchase Details
Closed on
Jun 21, 1999
Sold by
Clements Patsy Throckmorton
Bought by
Throckmorton Harold Eugene
Home Financials for this Owner
Home Financials are based on the most recent Mortgage that was taken out on this home.
Original Mortgage
$76,800
Interest Rate
6.9%
Purchase Details
Closed on
Jun 7, 1999
Sold by
Throckmorton Sarah
Bought by
Throckmorton Harold Eugene
Home Financials for this Owner
Home Financials are based on the most recent Mortgage that was taken out on this home.
Original Mortgage
$76,800
Interest Rate
6.9%
Create a Home Valuation Report for This Property
The Home Valuation Report is an in-depth analysis detailing your home's value as well as a comparison with similar homes in the area
Home Values in the Area
Average Home Value in this Area
Purchase History
| Date | Buyer | Sale Price | Title Company |
|---|---|---|---|
| Throckmorton Harold Eugene | -- | First American Title | |
| Throckmorton Harold Eugene | -- | Provo Land Title Company | |
| Throckmorton Harold Eugene | -- | Provo Land Title Company |
Source: Public Records
Mortgage History
| Date | Status | Borrower | Loan Amount |
|---|---|---|---|
| Previous Owner | Throckmorton Harold Eugene | $76,800 |
Source: Public Records
Tax History
| Year | Tax Paid | Tax Assessment Tax Assessment Total Assessment is a certain percentage of the fair market value that is determined by local assessors to be the total taxable value of land and additions on the property. | Land | Improvement |
|---|---|---|---|---|
| 2025 | $1,359 | $179,245 | -- | -- |
| 2024 | $1,359 | $166,210 | $0 | $0 |
| 2023 | $1,254 | $164,835 | $0 | $0 |
| 2022 | $1,394 | $177,430 | $0 | $0 |
| 2021 | $1,235 | $238,100 | $105,500 | $132,600 |
| 2020 | $1,124 | $213,100 | $84,400 | $128,700 |
| 2019 | $996 | $196,300 | $84,400 | $111,900 |
| 2018 | $947 | $178,400 | $81,100 | $97,300 |
| 2017 | $851 | $85,800 | $0 | $0 |
| 2016 | $784 | $72,930 | $0 | $0 |
| 2015 | $793 | $69,740 | $0 | $0 |
| 2014 | $789 | $69,080 | $0 | $0 |
Source: Public Records
Map
Nearby Homes
- 474 N Emery Ave
- 489 N Beverly Ave
- 557 N Emery Ave
- 875 W 530 N
- 686 N 835 W
- 1004 W 400 N
- 954 W 630 N Unit 34,
- 1058 W 570 St N
- 1094 W 465 N
- 162 N 450 W Unit 2
- 223 N 360 W
- 222 N 1200 W Unit 144
- 222 N 1200 W Unit 84
- 285 N 300 W
- 597 N State St Unit 25
- 565 W 40 N
- 508 W 40 N
- 241 W 310 St N
- 930 N 980 W
- 45 N 970 W
- 467 Emery Ave
- 451 Emery Ave
- 473 Emery Ave
- 462 Beverly Ave Unit 1
- 457 Beverly Ave
- 462 N Beverly Ave
- 443 Emery Ave
- 460 N Emery Ave
- 460 N Emery Ave Unit 9
- 742 W 450 N
- 430 N Beverly Ave
- 472 Beverly Ave
- 750 W 450 N
- 454 Emery Ave
- 460 Emery Ave
- 468 Emery Ave
- 448 Emery Ave
- 485 Emery Ave
- 758 W 450 N
- 449 Beverly Ave Unit 1
Your Personal Tour Guide
Ask me questions while you tour the home.