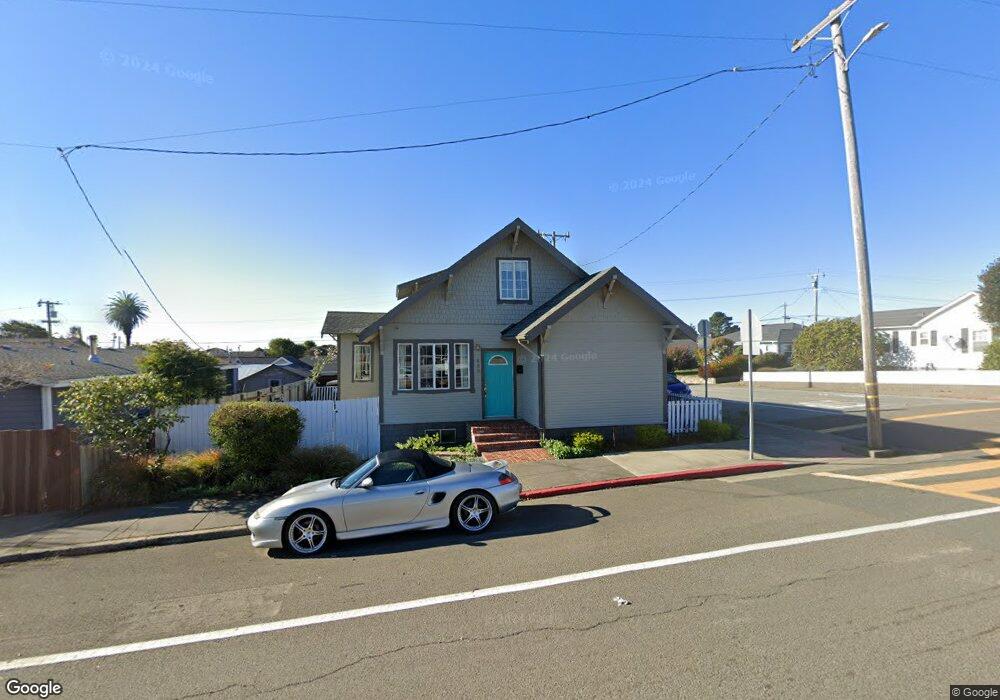
459 N Harold St Fort Bragg, CA 95437
Estimated Value: $519,000 - $648,000
4
Beds
2
Baths
1,895
Sq Ft
$309/Sq Ft
Est. Value
About This Home
This home is located at 459 N Harold St, Fort Bragg, CA 95437 and is currently estimated at $586,182, approximately $309 per square foot. 459 N Harold St is a home located in Mendocino County with nearby schools including Fort Bragg High School and Three Rivers Charter School.
Ownership History
Date
Name
Owned For
Owner Type
Purchase Details
Closed on
Jan 20, 2016
Sold by
Comer Joseph Douglas and Comer China
Bought by
Connell Wendell O
Current Estimated Value
Home Financials for this Owner
Home Financials are based on the most recent Mortgage that was taken out on this home.
Original Mortgage
$295,213
Outstanding Balance
$234,481
Interest Rate
3.92%
Mortgage Type
VA
Estimated Equity
$351,701
Purchase Details
Closed on
Dec 3, 2003
Sold by
Paz Richard
Bought by
Paz Richard Mark and Leonard Charlene Dawn
Home Financials for this Owner
Home Financials are based on the most recent Mortgage that was taken out on this home.
Original Mortgage
$203,000
Interest Rate
5.92%
Mortgage Type
Purchase Money Mortgage
Purchase Details
Closed on
May 4, 2000
Sold by
Paoli David E and Paoli Darla J
Bought by
Paz Richard
Home Financials for this Owner
Home Financials are based on the most recent Mortgage that was taken out on this home.
Original Mortgage
$157,500
Interest Rate
9.62%
Mortgage Type
Purchase Money Mortgage
Create a Home Valuation Report for This Property
The Home Valuation Report is an in-depth analysis detailing your home's value as well as a comparison with similar homes in the area
Home Values in the Area
Average Home Value in this Area
Purchase History
| Date | Buyer | Sale Price | Title Company |
|---|---|---|---|
| Connell Wendell O | $289,000 | Redwood Empire Title Co Mend | |
| Paz Richard Mark | -- | First American Title Co | |
| Paz Richard | $175,000 | First American Title Co |
Source: Public Records
Mortgage History
| Date | Status | Borrower | Loan Amount |
|---|---|---|---|
| Open | Connell Wendell O | $295,213 | |
| Previous Owner | Paz Richard Mark | $203,000 | |
| Previous Owner | Paz Richard | $157,500 | |
| Closed | Paz Richard | $8,750 |
Source: Public Records
Tax History
| Year | Tax Paid | Tax Assessment Tax Assessment Total Assessment is a certain percentage of the fair market value that is determined by local assessors to be the total taxable value of land and additions on the property. | Land | Improvement |
|---|---|---|---|---|
| 2025 | $3,402 | $288,252 | $128,110 | $160,142 |
| 2023 | $3,402 | $277,061 | $123,137 | $153,924 |
| 2022 | $3,385 | $271,629 | $120,723 | $150,906 |
| 2021 | $3,194 | $266,304 | $118,356 | $147,948 |
| 2020 | $3,129 | $263,572 | $117,143 | $146,429 |
| 2019 | $3,089 | $258,406 | $114,847 | $143,559 |
| 2018 | $3,049 | $253,341 | $112,596 | $140,745 |
| 2017 | $2,836 | $248,375 | $110,389 | $137,986 |
| 2016 | $2,781 | $243,506 | $108,225 | $135,281 |
| 2015 | $2,737 | $239,850 | $106,600 | $133,250 |
| 2014 | $2,668 | $235,152 | $104,512 | $130,640 |
Source: Public Records
Map
Nearby Homes
- 399 Winifred St
- 1002 Cedar St
- 119 E Pine St
- 131 Halsey Way
- 210 S Mcpherson St
- 215 S Sanderson Way
- 104 Dana St
- 102 Dana St
- 459 S Mcpherson St
- 517 S Lincoln St
- 137 Olsen Ln
- 575 S Whipple St
- 227 Hocker Ln
- 1261 N Main St
- 19701 Noyo Acres Dr
- 19351 Del Mar Dr
- 19400 Dorffi Rd
- 19171 S Harbor Dr
- 19204 Benson Ln
- 14875 Atkins
- 451 N Harold St
- 632 E Pine St
- 445 N Harold St
- 455 N Harold St Unit 12
- 501 N Harold St
- 655 E Pine St
- 433 N Harold St
- 435 N Harold St
- 614 E Pine St
- 429 N Harold St
- 427 N Harold St
- 615 E Pine St
- 525 N Harold St
- 600 E Pine St
- 436 N Corry St
- 444 N Corry St
- 419 N Harold St
- 428 N Corry St
- 601 E Pine St
- 520 N Corry St
Your Personal Tour Guide
Ask me questions while you tour the home.