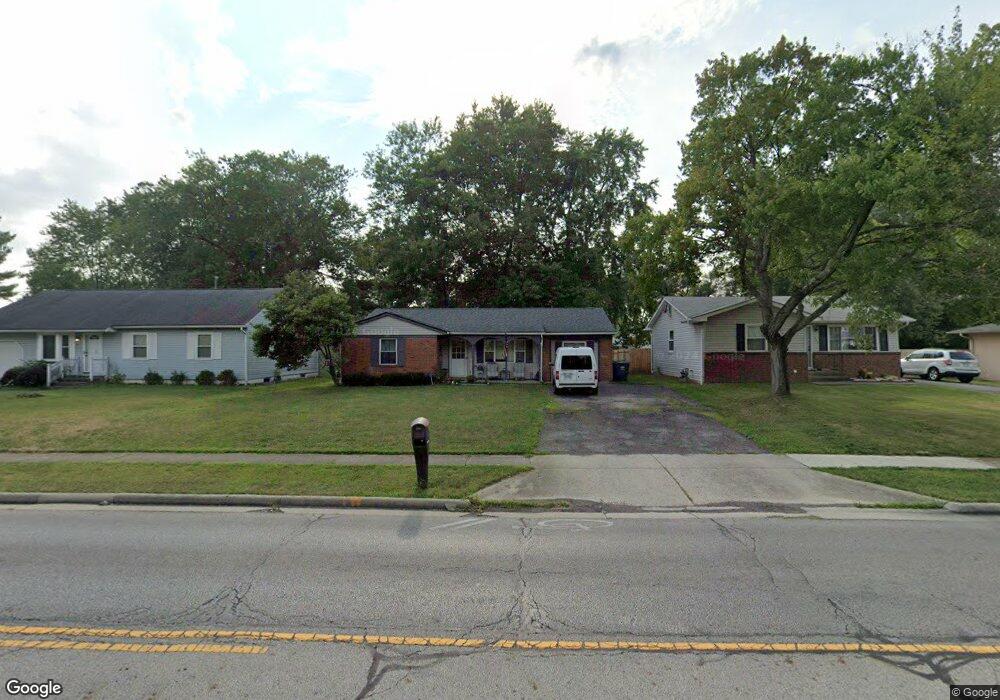
459 N Stygler Rd Columbus, OH 43230
Estimated Value: $215,000 - $289,000
3
Beds
1
Bath
1,082
Sq Ft
$225/Sq Ft
Est. Value
About This Home
This home is located at 459 N Stygler Rd, Columbus, OH 43230 and is currently estimated at $242,972, approximately $224 per square foot. 459 N Stygler Rd is a home located in Franklin County with nearby schools including Chapelfield Elementary School, Gahanna West Middle School, and Lincoln High School.
Ownership History
Date
Name
Owned For
Owner Type
Purchase Details
Closed on
May 27, 2011
Sold by
Winnestaffer Ricahrd A and Firstmeritt Bank Na
Bought by
T & M David Llc
Current Estimated Value
Purchase Details
Closed on
Aug 13, 1999
Sold by
Ernst Julie A
Bought by
Winnestaffer Richard A
Purchase Details
Closed on
Mar 3, 1998
Sold by
Cheek Tami K
Bought by
Ernst Julie A
Purchase Details
Closed on
Sep 26, 1995
Sold by
Cameruca Reno J
Bought by
Tami K Cheek
Home Financials for this Owner
Home Financials are based on the most recent Mortgage that was taken out on this home.
Original Mortgage
$59,300
Interest Rate
7.78%
Mortgage Type
New Conventional
Purchase Details
Closed on
Nov 25, 1994
Sold by
Shrf Melvin D Tobias Pr
Bought by
Camervca Reno J and Camervca Kathleen A
Create a Home Valuation Report for This Property
The Home Valuation Report is an in-depth analysis detailing your home's value as well as a comparison with similar homes in the area
Home Values in the Area
Average Home Value in this Area
Purchase History
| Date | Buyer | Sale Price | Title Company |
|---|---|---|---|
| T & M David Llc | $56,700 | None Available | |
| Winnestaffer Richard A | $76,000 | Independent Title | |
| Ernst Julie A | $58,000 | Pro Title | |
| Tami K Cheek | $65,900 | -- | |
| Camervca Reno J | $54,200 | -- |
Source: Public Records
Mortgage History
| Date | Status | Borrower | Loan Amount |
|---|---|---|---|
| Previous Owner | Tami K Cheek | $59,300 |
Source: Public Records
Tax History Compared to Growth
Tax History
| Year | Tax Paid | Tax Assessment Tax Assessment Total Assessment is a certain percentage of the fair market value that is determined by local assessors to be the total taxable value of land and additions on the property. | Land | Improvement |
|---|---|---|---|---|
| 2024 | $4,237 | $70,500 | $24,120 | $46,380 |
| 2023 | $4,185 | $70,490 | $24,115 | $46,375 |
| 2022 | $3,559 | $46,700 | $12,080 | $34,620 |
| 2021 | $3,445 | $46,700 | $12,080 | $34,620 |
| 2020 | $3,417 | $46,700 | $12,080 | $34,620 |
| 2019 | $2,889 | $39,270 | $10,080 | $29,190 |
| 2018 | $2,605 | $39,270 | $10,080 | $29,190 |
| 2017 | $2,658 | $39,270 | $10,080 | $29,190 |
| 2016 | $2,339 | $31,470 | $9,520 | $21,950 |
| 2015 | $2,341 | $31,470 | $9,520 | $21,950 |
| 2014 | $2,323 | $31,470 | $9,520 | $21,950 |
| 2013 | $1,155 | $31,465 | $9,520 | $21,945 |
Source: Public Records
Map
Nearby Homes
- 388 Elkwood Place
- 295 Imperial Dr
- 642 Ridenour Rd
- 249 Regents Rd
- 209 Imperial Dr
- 536 Springwood Lake Dr
- 343 Amesbury Dr
- 221 Lincolnshire Rd
- 3877 Hines Rd
- 638 Thistle Ave
- 4125 Emerius Dr
- 491 Daventry Ln
- 3118 Berkley Pointe Dr
- 2741 Acarie Dr
- 3150 Berkley Pointe Dr
- 108 Walcreek Dr W
- 600 Agler Rd
- 111 Nob Hill Dr N
- 2694 Kantian Dr
- 459 Bluestem Ave
- 463 N Stygler Rd
- 451 N Stygler Rd
- 469 N Stygler Rd
- 445 N Stygler Rd
- 458 Foxwood Dr
- 452 Foxwood Dr
- 444 Foxwood Dr
- 475 N Stygler Rd
- 437 N Stygler Rd
- 470 Foxwood Dr
- 350 Marjoram Dr
- 438 Foxwood Dr
- 348 Marjoram Dr
- 476 Foxwood Dr
- 481 N Stygler Rd
- 431 N Stygler Rd
- 345 Marjoram Dr
- 432 Foxwood Dr
- 478 Foxwood Dr
- 457 Foxwood Dr