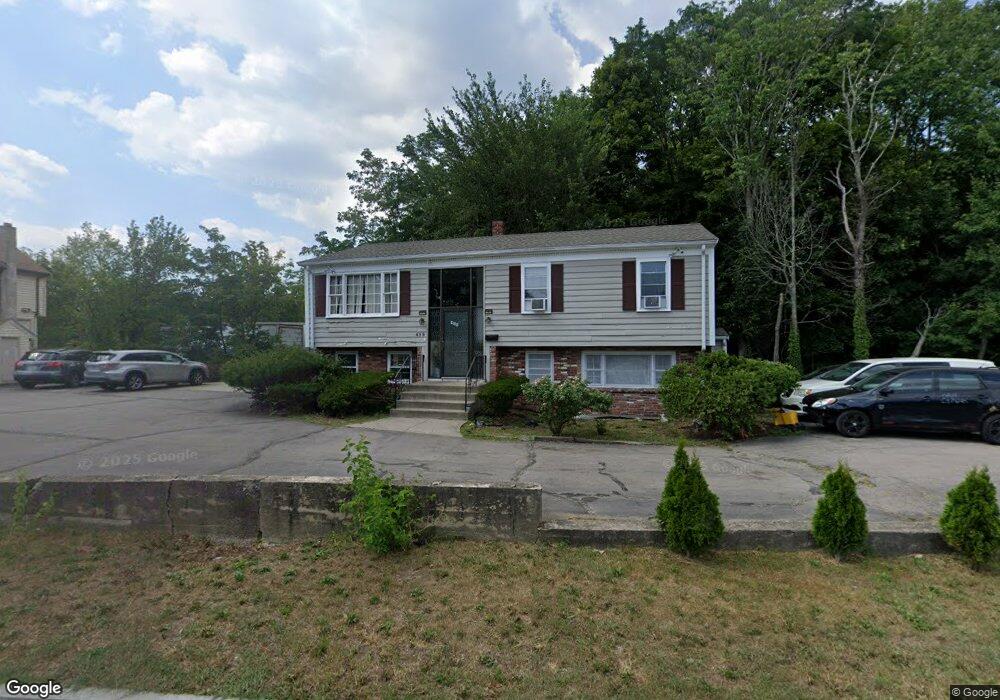
459 Prospect St Brockton, MA 02301
Estimated Value: $379,058
2
Beds
1
Bath
2,100
Sq Ft
$181/Sq Ft
Est. Value
About This Home
This home is located at 459 Prospect St, Brockton, MA 02301 and is currently estimated at $379,058, approximately $180 per square foot. 459 Prospect St is a home located in Plymouth County with nearby schools including Louis F Angelo Elementary School, Hancock Elementary School, and Raymond K-8 Elementary School.
Ownership History
Date
Name
Owned For
Owner Type
Purchase Details
Closed on
Aug 3, 2018
Sold by
Janed Rt
Bought by
459 Prospect Street Re
Current Estimated Value
Home Financials for this Owner
Home Financials are based on the most recent Mortgage that was taken out on this home.
Original Mortgage
$195,000
Outstanding Balance
$169,350
Interest Rate
4.5%
Mortgage Type
New Conventional
Estimated Equity
$209,708
Create a Home Valuation Report for This Property
The Home Valuation Report is an in-depth analysis detailing your home's value as well as a comparison with similar homes in the area
Home Values in the Area
Average Home Value in this Area
Purchase History
| Date | Buyer | Sale Price | Title Company |
|---|---|---|---|
| 459 Prospect Street Re | $225,000 | -- |
Source: Public Records
Mortgage History
| Date | Status | Borrower | Loan Amount |
|---|---|---|---|
| Open | 459 Prospect Street Re | $195,000 |
Source: Public Records
Tax History Compared to Growth
Tax History
| Year | Tax Paid | Tax Assessment Tax Assessment Total Assessment is a certain percentage of the fair market value that is determined by local assessors to be the total taxable value of land and additions on the property. | Land | Improvement |
|---|---|---|---|---|
| 2025 | $6,875 | $284,100 | $167,800 | $116,300 |
| 2024 | $6,833 | $284,100 | $152,600 | $131,500 |
| 2023 | $6,721 | $258,300 | $132,400 | $125,900 |
| 2022 | $6,600 | $234,200 | $132,400 | $101,800 |
| 2021 | $6,622 | $223,400 | $126,100 | $97,300 |
| 2020 | $6,794 | $223,400 | $120,100 | $103,300 |
| 2019 | $6,672 | $263,400 | $120,100 | $143,300 |
| 2018 | $6,130 | $263,400 | $120,100 | $143,300 |
| 2017 | $7,547 | $250,000 | $120,100 | $129,900 |
| 2016 | $7,547 | $235,690 | $120,060 | $115,630 |
| 2015 | $7,985 | $235,690 | $120,060 | $115,630 |
| 2014 | $8,004 | $235,690 | $120,060 | $115,630 |
Source: Public Records
Map
Nearby Homes
- 20 Montauk Rd
- 77 Colonel Bell Dr Unit 4
- 75 Colonel Bell Dr Unit 77-11
- 4 Park Rd
- 7 N Winnifred Rd
- 45 Cross St
- 721 Pleasant St
- 161 Moraine St
- 15 Troy St
- 72 W Elm Terrace
- 126 Coventry Cir
- 96 Coventry Cir
- 42 Baxendale Terrace
- 194 Prospect St
- 0 Moraine St
- 34 Eaton St
- 10 Fitzpatrick Ave
- 72 Kurland Ave
- 32 Milton St
- 137 Boylston St
- 471 Prospect St
- 1 Montauk Rd
- 507 Pleasant St
- 27 Madrid Square Unit 4
- 26 Madrid Square Unit 8
- 23 Madrid Square Unit 1
- 23 Madrid Square Unit 2
- 24 Madrid Square Unit 1
- 25 Madrid Square Unit 7
- 24 Madrid Square Unit 4
- 26 Madrid Square Unit 12
- 26 Madrid Square Unit 1
- 22 Madrid Square Unit 8,22
- 22 Madrid Square Unit 12
- 22 Madrid Square
- 23 Madrid Square Unit 8
- 26 Madrid Square Unit 3
- 23 Madrid Square
- 24 Madrid Square Unit 8
- 26 Madrid Square Unit 2