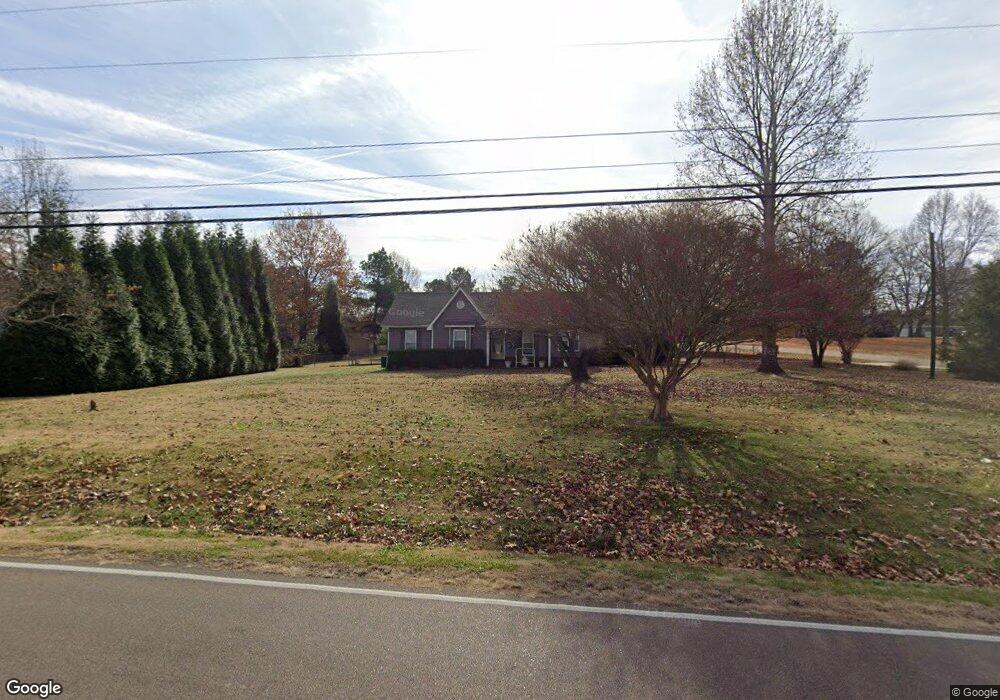
459 Tracy Rd Millington, TN 38053
Estimated Value: $252,825 - $291,000
3
Beds
2
Baths
1,436
Sq Ft
$190/Sq Ft
Est. Value
About This Home
This home is located at 459 Tracy Rd, Millington, TN 38053 and is currently estimated at $272,706, approximately $189 per square foot. 459 Tracy Rd is a home located in Tipton County with nearby schools including Atoka Elementary School, Munford Middle School, and Munford High School.
Ownership History
Date
Name
Owned For
Owner Type
Purchase Details
Closed on
Dec 6, 2016
Sold by
Rasar Liberty Dawn
Bought by
Rasar Jeffery L and Rasar Liberty Dawn
Current Estimated Value
Purchase Details
Closed on
Apr 15, 2011
Sold by
Hensley Jan
Bought by
Wiggins Liberty Dawn
Home Financials for this Owner
Home Financials are based on the most recent Mortgage that was taken out on this home.
Original Mortgage
$131,577
Interest Rate
5.5%
Mortgage Type
FHA
Purchase Details
Closed on
Sep 11, 2009
Sold by
Cooper Michelle Nicole
Bought by
Hensley Jan
Purchase Details
Closed on
Apr 22, 2005
Sold by
Mitchell Cecil R
Bought by
Cooper Michelle N
Home Financials for this Owner
Home Financials are based on the most recent Mortgage that was taken out on this home.
Original Mortgage
$125,000
Interest Rate
5.99%
Purchase Details
Closed on
Nov 29, 1993
Bought by
Mitchell Cecil
Purchase Details
Closed on
Jun 25, 1990
Bought by
Tankersley Buford and Tankersley Jane
Purchase Details
Closed on
Mar 7, 1989
Bought by
Ballard Wayne and Ballard Peggy
Create a Home Valuation Report for This Property
The Home Valuation Report is an in-depth analysis detailing your home's value as well as a comparison with similar homes in the area
Home Values in the Area
Average Home Value in this Area
Purchase History
| Date | Buyer | Sale Price | Title Company |
|---|---|---|---|
| Rasar Jeffery L | -- | -- | |
| Wiggins Liberty Dawn | $135,000 | -- | |
| Hensley Jan | $71,000 | -- | |
| Cooper Michelle N | $125,000 | -- | |
| Mitchell Cecil | $83,500 | -- | |
| Tankersley Buford | $8,000 | -- | |
| Ballard Wayne | -- | -- |
Source: Public Records
Mortgage History
| Date | Status | Borrower | Loan Amount |
|---|---|---|---|
| Previous Owner | Wiggins Liberty Dawn | $131,577 | |
| Previous Owner | Ballard Wayne | $125,000 |
Source: Public Records
Tax History Compared to Growth
Tax History
| Year | Tax Paid | Tax Assessment Tax Assessment Total Assessment is a certain percentage of the fair market value that is determined by local assessors to be the total taxable value of land and additions on the property. | Land | Improvement |
|---|---|---|---|---|
| 2024 | $805 | $52,900 | $7,825 | $45,075 |
| 2023 | $805 | $52,900 | $7,825 | $45,075 |
| 2022 | $762 | $37,350 | $5,750 | $31,600 |
| 2021 | $762 | $37,350 | $5,750 | $31,600 |
| 2020 | $762 | $37,350 | $5,750 | $31,600 |
| 2019 | $699 | $28,875 | $5,350 | $23,525 |
| 2018 | $699 | $28,875 | $5,350 | $23,525 |
| 2017 | $699 | $28,875 | $5,350 | $23,525 |
| 2016 | $699 | $28,875 | $5,350 | $23,525 |
| 2015 | $698 | $28,875 | $5,350 | $23,525 |
| 2014 | $698 | $28,870 | $0 | $0 |
Source: Public Records
Map
Nearby Homes
- 595 Hickory Ln
- 663 Tracy Rd
- 0 Hickory Ln
- 0 Simmons Rd Unit 10197057
- 9700 N Helene Cove
- 9509 Merrill Rd
- 321 Switchgrass Cove
- 153 Ash Rene Dr
- 0 Reed Cir Unit 10192357
- 121 Reed Cir
- 97 Rachel Cove
- 0 Bethuel Church Rd Unit RTC2971170
- 95 Wallace Cove
- 856 Reed Cir
- 21 Rose Bush St
- 27 Rose Bush St
- 256 Azalea Dr
- 447 Abbey Rd Unit D
- 231 Country Meadow Ln
- 13724 51 S Highway Hwy