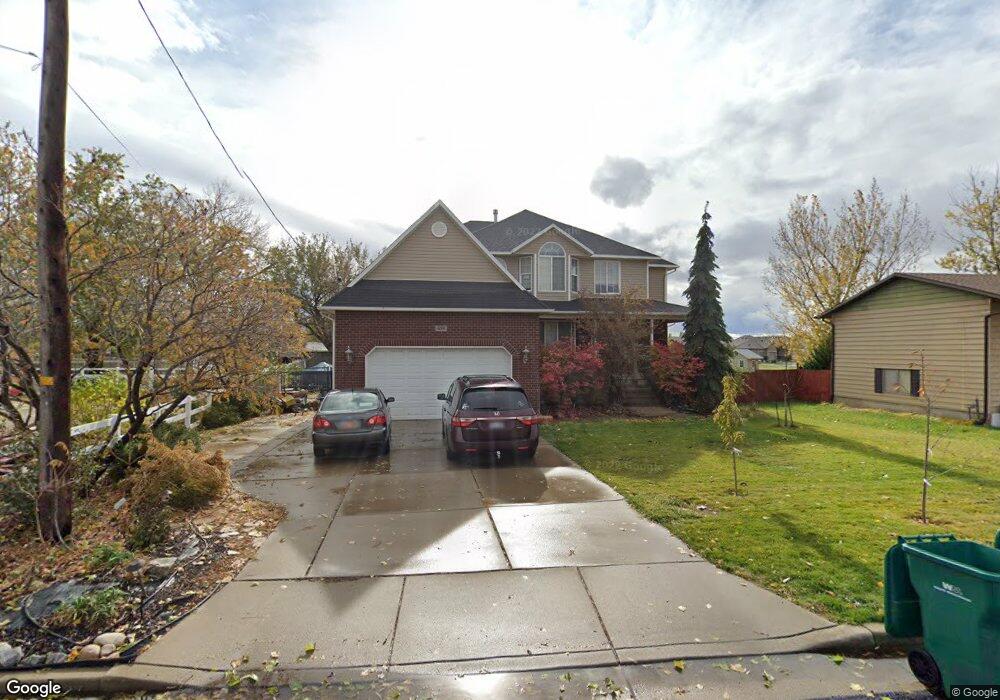
459 Weaver Ln Layton, UT 84041
Estimated Value: $632,000 - $937,000
6
Beds
4
Baths
3,952
Sq Ft
$198/Sq Ft
Est. Value
About This Home
This home is located at 459 Weaver Ln, Layton, UT 84041 and is currently estimated at $784,346, approximately $198 per square foot. 459 Weaver Ln is a home located in Davis County with nearby schools including Layton Elementary School, Fairfield Junior High School, and Layton High School.
Ownership History
Date
Name
Owned For
Owner Type
Purchase Details
Closed on
May 6, 2024
Sold by
Brown Eric and Brown Ragan
Bought by
Eric And Ragan Brown Living Trust and Brown
Current Estimated Value
Purchase Details
Closed on
Aug 25, 2017
Sold by
Bean Susan A and Bean Barry D
Bought by
Brown Eric and Brown Ragan
Home Financials for this Owner
Home Financials are based on the most recent Mortgage that was taken out on this home.
Original Mortgage
$372,000
Interest Rate
4.03%
Mortgage Type
New Conventional
Purchase Details
Closed on
Oct 27, 2003
Sold by
Sierra Pacific Homes Inc
Bought by
Powell Richard T and Powell Susan A
Home Financials for this Owner
Home Financials are based on the most recent Mortgage that was taken out on this home.
Original Mortgage
$209,926
Interest Rate
6.14%
Mortgage Type
Purchase Money Mortgage
Create a Home Valuation Report for This Property
The Home Valuation Report is an in-depth analysis detailing your home's value as well as a comparison with similar homes in the area
Home Values in the Area
Average Home Value in this Area
Purchase History
| Date | Buyer | Sale Price | Title Company |
|---|---|---|---|
| Eric And Ragan Brown Living Trust | -- | None Listed On Document | |
| Brown Eric | -- | Inwest Title | |
| Powell Richard T | -- | Title West Title Company |
Source: Public Records
Mortgage History
| Date | Status | Borrower | Loan Amount |
|---|---|---|---|
| Previous Owner | Brown Eric | $372,000 | |
| Previous Owner | Powell Richard T | $209,926 |
Source: Public Records
Tax History
| Year | Tax Paid | Tax Assessment Tax Assessment Total Assessment is a certain percentage of the fair market value that is determined by local assessors to be the total taxable value of land and additions on the property. | Land | Improvement |
|---|---|---|---|---|
| 2025 | $3,799 | $398,751 | $174,560 | $224,191 |
| 2024 | $3,605 | $381,149 | $193,189 | $187,960 |
| 2023 | $3,611 | $370,150 | $129,983 | $240,166 |
| 2022 | $3,864 | $711,000 | $213,765 | $497,235 |
| 2021 | $3,518 | $531,000 | $176,186 | $354,814 |
| 2020 | $3,170 | $459,000 | $155,794 | $303,206 |
| 2019 | $3,130 | $444,000 | $141,373 | $302,627 |
| 2018 | $2,865 | $408,000 | $125,942 | $282,058 |
| 2016 | $931 | $169,675 | $59,300 | $110,375 |
| 2015 | $2,376 | $165,660 | $59,300 | $106,360 |
| 2014 | $2,558 | $182,402 | $59,300 | $123,102 |
| 2013 | -- | $153,025 | $47,830 | $105,195 |
Source: Public Records
Map
Nearby Homes
- 383 S 950 W
- 765 W Farming Way
- 80 E 850 S
- 88 Ellison St
- 799 S 125 E
- 257 S 950 W
- 418 W Gentile St
- 355 W Gentile St
- 339 W 25 N Unit 6
- 356 W 25 N
- 1115 W 550 S
- 361 W 50 N
- 753 S 300 E
- 630 W 100 N
- 933 W Gentile St
- 1038 S Old Towne Rd
- 1048 S Old Towne Rd
- 189 S Main St Unit 76
- 189 S Main St Unit 21
- 24 Grover St
Your Personal Tour Guide
Ask me questions while you tour the home.