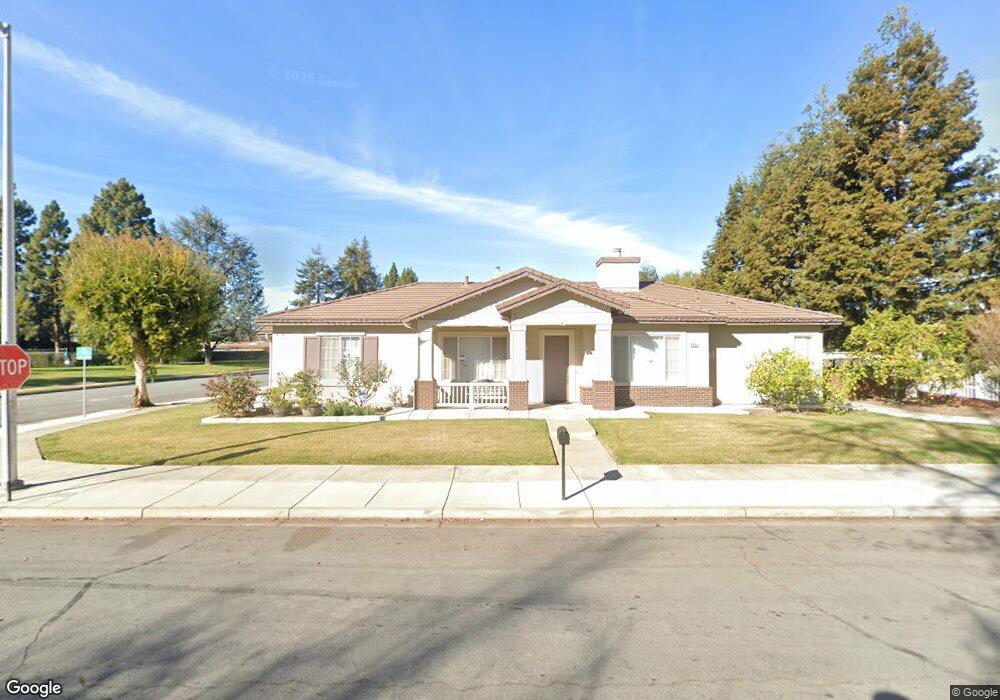
4591 Eggers Dr Fremont, CA 94536
Glenmoor NeighborhoodEstimated Value: $1,892,000 - $2,269,000
3
Beds
3
Baths
2,149
Sq Ft
$943/Sq Ft
Est. Value
About This Home
This home is located at 4591 Eggers Dr, Fremont, CA 94536 and is currently estimated at $2,026,563, approximately $943 per square foot. 4591 Eggers Dr is a home located in Alameda County with nearby schools including Glenmoor Elementary School, Centerville Junior High School, and Washington High School.
Ownership History
Date
Name
Owned For
Owner Type
Purchase Details
Closed on
Jun 16, 2016
Sold by
Sharma Manish
Bought by
Sharma Manish and Sharma Aditi
Current Estimated Value
Purchase Details
Closed on
May 12, 2016
Sold by
Kunwar Surendra Sharma and Kunwar Surendra
Bought by
The Sharma Family Revocable Trust
Purchase Details
Closed on
Nov 24, 1999
Sold by
Summerhill Glenmoor Ltd
Bought by
Kunwar Surendra and Sharma Manish
Home Financials for this Owner
Home Financials are based on the most recent Mortgage that was taken out on this home.
Original Mortgage
$406,400
Outstanding Balance
$121,699
Interest Rate
7.5%
Estimated Equity
$1,904,864
Purchase Details
Closed on
Nov 23, 1999
Sold by
Sharma Manju
Bought by
Kunwar Surendra
Home Financials for this Owner
Home Financials are based on the most recent Mortgage that was taken out on this home.
Original Mortgage
$406,400
Outstanding Balance
$121,699
Interest Rate
7.5%
Estimated Equity
$1,904,864
Create a Home Valuation Report for This Property
The Home Valuation Report is an in-depth analysis detailing your home's value as well as a comparison with similar homes in the area
Home Values in the Area
Average Home Value in this Area
Purchase History
| Date | Buyer | Sale Price | Title Company |
|---|---|---|---|
| Sharma Manish | -- | None Available | |
| The Sharma Family Revocable Trust | -- | None Available | |
| Kunwar Surendra | $508,000 | First American Title Guarant | |
| Kunwar Surendra | -- | First American Title Guarant |
Source: Public Records
Mortgage History
| Date | Status | Borrower | Loan Amount |
|---|---|---|---|
| Open | Kunwar Surendra | $406,400 | |
| Closed | Kunwar Surendra | $76,200 |
Source: Public Records
Tax History Compared to Growth
Tax History
| Year | Tax Paid | Tax Assessment Tax Assessment Total Assessment is a certain percentage of the fair market value that is determined by local assessors to be the total taxable value of land and additions on the property. | Land | Improvement |
|---|---|---|---|---|
| 2025 | $9,405 | $773,082 | $233,299 | $546,783 |
| 2024 | $9,405 | $757,789 | $228,726 | $536,063 |
| 2023 | $9,151 | $749,795 | $224,241 | $525,554 |
| 2022 | $9,029 | $728,096 | $219,845 | $515,251 |
| 2021 | $8,807 | $713,686 | $215,536 | $505,150 |
| 2020 | $8,823 | $713,301 | $213,327 | $499,974 |
| 2019 | $8,722 | $699,317 | $209,145 | $490,172 |
| 2018 | $8,551 | $685,608 | $205,045 | $480,563 |
| 2017 | $8,337 | $672,167 | $201,025 | $471,142 |
| 2016 | $8,193 | $658,990 | $197,084 | $461,906 |
| 2015 | $8,082 | $649,093 | $194,124 | $454,969 |
| 2014 | $7,942 | $636,378 | $190,322 | $446,056 |
Source: Public Records
Map
Nearby Homes
- 4715 Eggers Dr
- 4586 Norris Rd
- 4754 Northdale Dr
- 4328 Cognina Ct
- 38324 Blacow Rd
- 38265 Corrigan Ct
- 37621 Glenmoor Dr
- 37721 Madera Ct
- 4237 Garland Dr
- 37987 Alta Dr
- 37792 Colfax Ct
- 5169 Lawler Ave
- 3810 Burton Common
- 4737 Deadwood Dr
- 4714 Serra Ave
- 3833 Burton Common
- 38837 Fremont Blvd
- 39090 Presidio Way Unit 237
- 5268 Keeler Ct
- Plan 1629 at Veranda
- 38318 Glenmoor Dr
- 4600 Eggers Dr Unit D
- 4600 Eggers Dr Unit A
- 4600 Eggers Dr Unit E
- 4600 Eggers Dr
- 38302 Glenmoor Dr
- 38286 Glenmoor Dr
- 4531 Meyer Park Cir
- 38437 Glenmoor Dr
- 38270 Glenmoor Dr
- 38458 Glenmoor Dr
- 4527 Meyer Park Cir
- 4589 Mayfield Ct
- 4606 Eggers Dr
- 4603 Mayfield Dr
- 4573 Mayfield Ct
- 38254 Glenmoor Dr
- 4540 Meyer Park Cir
- 4619 Eggers Dr
- 4523 Meyer Park Cir