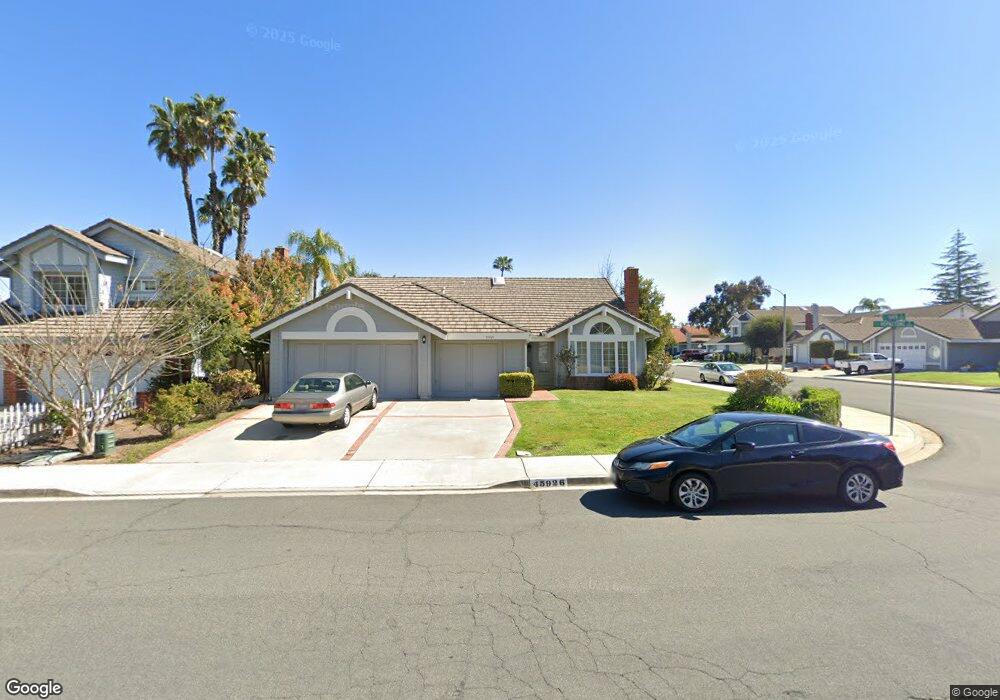
45926 Hopactong St Temecula, CA 92592
Estimated Value: $638,000 - $774,000
3
Beds
2
Baths
2,142
Sq Ft
$333/Sq Ft
Est. Value
About This Home
This home is located at 45926 Hopactong St, Temecula, CA 92592 and is currently estimated at $712,468, approximately $332 per square foot. 45926 Hopactong St is a home located in Riverside County with nearby schools including Temecula Luiseno Elementary, Erle Stanley Gardner Middle School, and Great Oak High School.
Ownership History
Date
Name
Owned For
Owner Type
Purchase Details
Closed on
Oct 24, 2009
Sold by
Abrenica Nicanor M and Abrenica Darlene R
Bought by
Abrenica Darlene R
Current Estimated Value
Purchase Details
Closed on
Jul 3, 2007
Sold by
Abrenica Nicanor M
Bought by
Abrenica Nicanor M and Abrenica Darlene R
Purchase Details
Closed on
Jun 18, 2007
Sold by
Abrenica Darlene R and Abrencia Darlene R
Bought by
Abrenica Nicanor M
Purchase Details
Closed on
Jul 21, 2004
Sold by
Stokes Brian
Bought by
Abrencia Nicanor M and Abrencia Darlene R
Home Financials for this Owner
Home Financials are based on the most recent Mortgage that was taken out on this home.
Original Mortgage
$339,600
Outstanding Balance
$153,119
Interest Rate
4.75%
Mortgage Type
Purchase Money Mortgage
Estimated Equity
$559,349
Purchase Details
Closed on
Dec 30, 1993
Sold by
Thomas John and Thomas Helen M
Bought by
Stokes Roy L and Stokes Lois J
Create a Home Valuation Report for This Property
The Home Valuation Report is an in-depth analysis detailing your home's value as well as a comparison with similar homes in the area
Purchase History
| Date | Buyer | Sale Price | Title Company |
|---|---|---|---|
| Abrenica Darlene R | -- | None Available | |
| Abrenica Nicanor M | -- | Accommodation | |
| Abrenica Nicanor M | -- | Alliance Title Company | |
| Abrencia Nicanor M | $424,500 | North American Title Co | |
| Stokes Roy L | $180,000 | First American Title Ins Co |
Source: Public Records
Mortgage History
| Date | Status | Borrower | Loan Amount |
|---|---|---|---|
| Open | Abrencia Nicanor M | $339,600 | |
| Closed | Abrencia Nicanor M | $63,675 |
Source: Public Records
Tax History
| Year | Tax Paid | Tax Assessment Tax Assessment Total Assessment is a certain percentage of the fair market value that is determined by local assessors to be the total taxable value of land and additions on the property. | Land | Improvement |
|---|---|---|---|---|
| 2025 | $6,812 | $591,692 | $144,956 | $446,736 |
| 2023 | $6,812 | $568,718 | $139,328 | $429,390 |
| 2022 | $6,600 | $557,568 | $136,597 | $420,971 |
| 2021 | $5,920 | $497,894 | $122,374 | $375,520 |
| 2020 | $5,315 | $444,548 | $109,262 | $335,286 |
| 2019 | $5,187 | $431,600 | $106,080 | $325,520 |
| 2018 | $4,991 | $415,000 | $102,000 | $313,000 |
| 2017 | $4,911 | $408,000 | $100,000 | $308,000 |
| 2016 | $4,624 | $383,000 | $94,000 | $289,000 |
| 2015 | $4,459 | $370,000 | $91,000 | $279,000 |
| 2014 | $3,969 | $331,000 | $81,000 | $250,000 |
Source: Public Records
Map
Nearby Homes
- 31352 Via Eduardo
- 31155 Lahontan St
- 31348 Huron St
- 45374 Zuma Dr
- 31125 Shicali Ct
- 31579 Mendocino Ct
- 31543 Mendocino Ct
- 31218 Comotilo Ct
- 31814 Murdock Ln
- 31889 Red Pine Way
- 31937 Red Pine Way Unit 80
- 45320 Esmerado Ct
- 45303 Esmerado Ct
- 30945 Loma Linda Rd
- 31605 Seastar Place
- 45575 Hawk Ct
- 45511 Seagull Way
- 45495 Peacock Place
- 46212 Pinon Pine Way
- 45971 Hunter Lodge Ln
- 45906 Hopactong St
- 45923 Jeronimo St
- 45884 Hopactong St
- 45918 Jeronimo St
- 31333 Pahuta St
- 45879 Jeronimo St
- 31325 Pahuta St
- 31341 Pahuta St
- 45910 Hopactong St
- 45862 Hopactong St
- 31317 Pahuta St
- 45920 Hopactong St
- 45890 Hopactong St
- 31349 Pahuta St
- 45930 Hopactong St
- 45840 Hopactong St
- 45835 Jeronimo St
- 31344 Via Eduardo
- 31336 Via Eduardo
- 31328 Via Eduardo
Your Personal Tour Guide
Ask me questions while you tour the home.