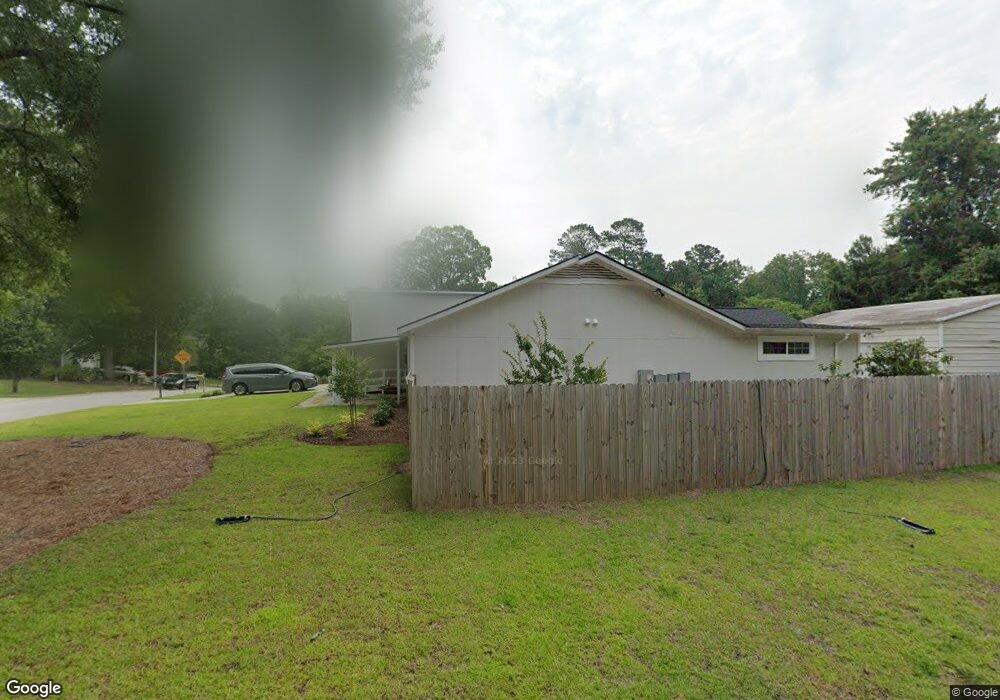
4595 Ferncreek Dr Fayetteville, NC 28314
Douglas Byrd NeighborhoodEstimated Value: $266,000 - $329,000
3
Beds
2
Baths
2,803
Sq Ft
$107/Sq Ft
Est. Value
About This Home
This home is located at 4595 Ferncreek Dr, Fayetteville, NC 28314 and is currently estimated at $299,932, approximately $107 per square foot. 4595 Ferncreek Dr is a home located in Cumberland County with nearby schools including Montclair Elementary, R. Max Abbott Middle School, and Terry Sanford High.
Ownership History
Date
Name
Owned For
Owner Type
Purchase Details
Closed on
May 21, 2024
Sold by
Cresfund Holdings Llc
Bought by
Miller Apartments Llc
Current Estimated Value
Purchase Details
Closed on
Mar 26, 2024
Sold by
Diversified Capital Investment I Llc
Bought by
Cresfund Holdings Llc
Purchase Details
Closed on
Nov 11, 2022
Sold by
Alternative Investment Holdings Inc
Bought by
Diversified Capital Investments I Llc
Purchase Details
Closed on
Feb 14, 2020
Sold by
Nivens Cherry A
Bought by
Alternative Investment Holdings Inc
Purchase Details
Closed on
Jun 24, 2008
Sold by
Sterling Duane
Bought by
Nivens Cherry A
Home Financials for this Owner
Home Financials are based on the most recent Mortgage that was taken out on this home.
Original Mortgage
$87,624
Interest Rate
5.97%
Mortgage Type
FHA
Create a Home Valuation Report for This Property
The Home Valuation Report is an in-depth analysis detailing your home's value as well as a comparison with similar homes in the area
Home Values in the Area
Average Home Value in this Area
Purchase History
| Date | Buyer | Sale Price | Title Company |
|---|---|---|---|
| Miller Apartments Llc | -- | None Listed On Document | |
| Cresfund Holdings Llc | -- | None Listed On Document | |
| Diversified Capital Investments I Llc | -- | -- | |
| Alternative Investment Holdings Inc | $95,000 | Morehead Title Company | |
| Nivens Cherry A | $89,000 | -- |
Source: Public Records
Mortgage History
| Date | Status | Borrower | Loan Amount |
|---|---|---|---|
| Previous Owner | Nivens Cherry A | $87,624 |
Source: Public Records
Tax History Compared to Growth
Tax History
| Year | Tax Paid | Tax Assessment Tax Assessment Total Assessment is a certain percentage of the fair market value that is determined by local assessors to be the total taxable value of land and additions on the property. | Land | Improvement |
|---|---|---|---|---|
| 2024 | $3,853 | $201,053 | $20,000 | $181,053 |
| 2023 | $3,345 | $201,053 | $20,000 | $181,053 |
| 2022 | $3,007 | $196,188 | $20,000 | $176,188 |
| 2021 | $3,007 | $196,188 | $20,000 | $176,188 |
| 2019 | $2,923 | $200,600 | $20,000 | $180,600 |
| 2018 | $2,923 | $200,600 | $20,000 | $180,600 |
| 2017 | $2,820 | $200,600 | $20,000 | $180,600 |
| 2016 | $2,579 | $197,000 | $18,000 | $179,000 |
| 2015 | $2,552 | $197,000 | $18,000 | $179,000 |
| 2014 | $2,545 | $197,000 | $18,000 | $179,000 |
Source: Public Records
Map
Nearby Homes
- 4593 Ferncreek Dr
- 4594 Oakfield Ct
- 4594 Ferncreek Dr
- 505 Tradewinds Dr
- 508 Tradewinds Dr
- 4600 Pine Needle Ct
- 4590 Oakfield Ct
- 504 Tradewinds Dr
- 4590 Ferncreek Dr
- 4586 Oakfield Ct
- 4587 Ferncreek Dr
- 4604 Pine Needle Ct
- 504 Lost Tree Ct
- 4507 Windcross Ct
- 500 Tradewinds Dr
- 4601 Pine Needle Ct
- 4503 Windcross Ct
- 4608 Needle Pine
- 4599 Oakfield Ct
- 4505 Windcross Ct