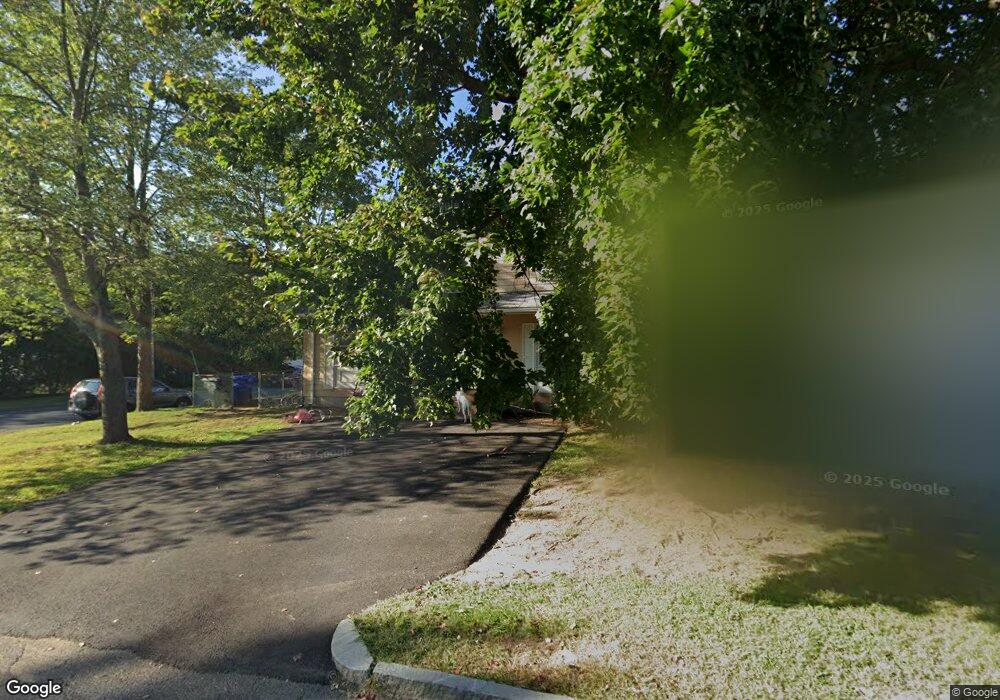
46-48 Blanding St Springfield, MA 01151
Indian Orchard NeighborhoodEstimated Value: $252,000 - $351,000
4
Beds
2
Baths
1,728
Sq Ft
$169/Sq Ft
Est. Value
About This Home
This home is located at 46-48 Blanding St, Springfield, MA 01151 and is currently estimated at $291,781, approximately $168 per square foot. 46-48 Blanding St is a home located in Hampden County with nearby schools including Warner, John F. Kennedy Academy, and Roger L. Putnam Vocational Technical Academy.
Ownership History
Date
Name
Owned For
Owner Type
Purchase Details
Closed on
Jan 20, 2023
Sold by
D Smith Re Holdings Inc
Bought by
Foy James R
Current Estimated Value
Home Financials for this Owner
Home Financials are based on the most recent Mortgage that was taken out on this home.
Original Mortgage
$186,558
Outstanding Balance
$180,293
Interest Rate
6.33%
Mortgage Type
FHA
Estimated Equity
$111,488
Purchase Details
Closed on
Jan 29, 2007
Sold by
Lamberth John M and Roach Lanier M
Bought by
L & J Properties
Home Financials for this Owner
Home Financials are based on the most recent Mortgage that was taken out on this home.
Original Mortgage
$142,400
Interest Rate
6.15%
Mortgage Type
Purchase Money Mortgage
Purchase Details
Closed on
Jul 10, 1996
Sold by
Ochrymowicz Frances A
Bought by
Roach Lanier M and Lambeth John M
Home Financials for this Owner
Home Financials are based on the most recent Mortgage that was taken out on this home.
Original Mortgage
$17,000
Interest Rate
7.98%
Mortgage Type
Purchase Money Mortgage
Create a Home Valuation Report for This Property
The Home Valuation Report is an in-depth analysis detailing your home's value as well as a comparison with similar homes in the area
Home Values in the Area
Average Home Value in this Area
Purchase History
| Date | Buyer | Sale Price | Title Company |
|---|---|---|---|
| Foy James R | $190,000 | None Available | |
| Foy James R | $190,000 | None Available | |
| L & J Properties | -- | -- | |
| D Smith Re Holdings In | $149,900 | -- | |
| L & J Properties | -- | -- | |
| Roach Lanier M | $85,000 | -- | |
| Roach Lanier M | $85,000 | -- |
Source: Public Records
Mortgage History
| Date | Status | Borrower | Loan Amount |
|---|---|---|---|
| Open | Foy James R | $186,558 | |
| Closed | Foy James R | $186,558 | |
| Previous Owner | L & J Properties | $142,400 | |
| Previous Owner | Roach Lanier M | $0 | |
| Previous Owner | Roach Lanier M | $85,000 | |
| Previous Owner | Roach Lanier M | $17,000 |
Source: Public Records
Tax History Compared to Growth
Tax History
| Year | Tax Paid | Tax Assessment Tax Assessment Total Assessment is a certain percentage of the fair market value that is determined by local assessors to be the total taxable value of land and additions on the property. | Land | Improvement |
|---|---|---|---|---|
| 2025 | $4,020 | $256,400 | $44,500 | $211,900 |
| 2024 | $4,071 | $253,500 | $41,600 | $211,900 |
| 2023 | $4,160 | $244,000 | $34,100 | $209,900 |
| 2022 | $3,834 | $203,700 | $31,900 | $171,800 |
| 2021 | $3,548 | $187,700 | $29,000 | $158,700 |
| 2020 | $3,597 | $184,200 | $29,000 | $155,200 |
| 2019 | $2,907 | $147,700 | $30,000 | $117,700 |
| 2018 | $2,843 | $145,900 | $30,000 | $115,900 |
| 2017 | $2,843 | $144,600 | $25,500 | $119,100 |
| 2016 | $2,399 | $122,000 | $25,500 | $96,500 |
| 2015 | $2,319 | $117,900 | $25,500 | $92,400 |
Source: Public Records
Map
Nearby Homes
- 140 Cardinal St
- 0 Michon St
- 97-99 Pine Grove St
- 98 Pine Grove St
- 89 Pine Grove St
- 31 Wing St
- 34 Temby St
- 49 Mohegan Ave
- 61 Glenmore St
- 37 Champlain Ave
- 189 Essex St Unit H
- 501 Oak St
- 42 Geneva St
- 70 Nagle St
- 25 Pioneer Way
- 130 Mazarin St
- 108 Barre St
- 70 Shumway St Unit 29
- 70 Shumway St Unit A1
- 32 Better Way
- 46 Blanding St Unit 48
- 46 Blanding St
- 40 Blanding St
- 53 Farnham Ave Unit 55
- 36 Blanding St Unit 36
- 34 Blanding St Unit 36
- 43 Blanding St Unit 45
- 39 Blanding St
- 64 Blanding St
- 54 Farnham Ave Unit 56
- 28-30 Blanding St
- 28 Blanding St Unit 30
- 35 Blanding St
- 43 Farnham Ave Unit 45
- 85 Beverly Ln Unit 87
- 29 Blanding St
- 65 Beverly Ln
- 22 Blanding St
- 124 Dubois St
- 25 Blanding St