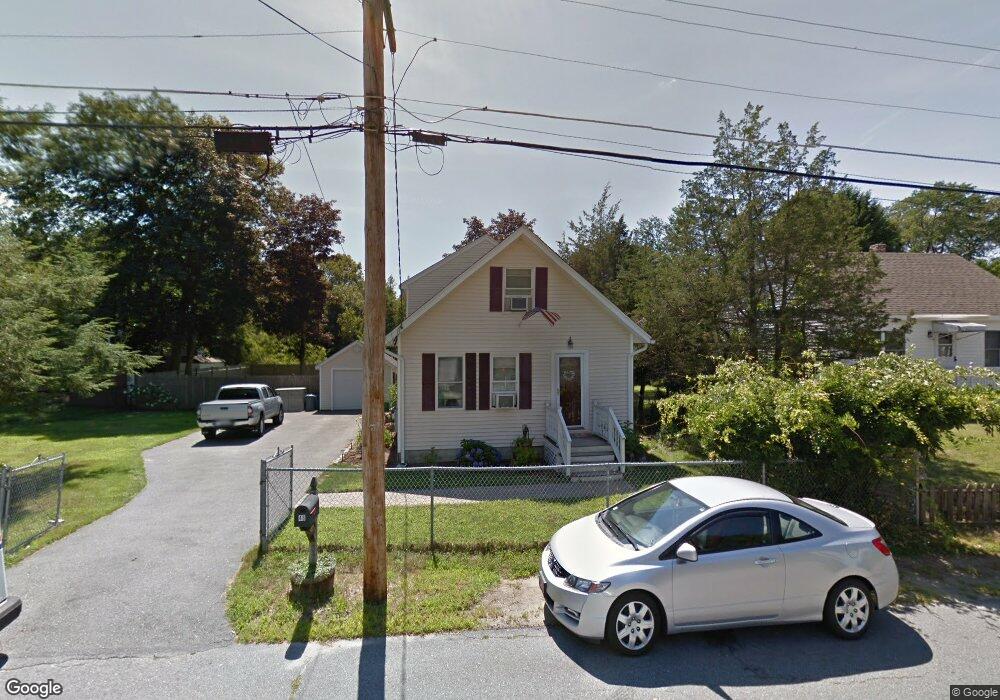
46 Brand Ave Wilmington, MA 01887
Estimated Value: $592,000 - $696,000
3
Beds
1
Bath
792
Sq Ft
$824/Sq Ft
Est. Value
About This Home
This home is located at 46 Brand Ave, Wilmington, MA 01887 and is currently estimated at $652,948, approximately $824 per square foot. 46 Brand Ave is a home located in Middlesex County with nearby schools including Wilmington Middle School, Wilmington High School, and Abundant Life Christian School and Childcare.
Ownership History
Date
Name
Owned For
Owner Type
Purchase Details
Closed on
Dec 17, 1996
Sold by
Fnma
Bought by
King Neal L and King Bonnie
Current Estimated Value
Home Financials for this Owner
Home Financials are based on the most recent Mortgage that was taken out on this home.
Original Mortgage
$117,229
Interest Rate
7.75%
Mortgage Type
Purchase Money Mortgage
Purchase Details
Closed on
Nov 25, 1996
Sold by
Hayward James C and Fleet Mtg Group
Bought by
Fleet Mtg Group
Home Financials for this Owner
Home Financials are based on the most recent Mortgage that was taken out on this home.
Original Mortgage
$117,229
Interest Rate
7.75%
Mortgage Type
Purchase Money Mortgage
Purchase Details
Closed on
May 29, 1992
Sold by
Sheridan Edward P and Sheridan Loretta
Bought by
Hayward James and Hayward Alyson
Home Financials for this Owner
Home Financials are based on the most recent Mortgage that was taken out on this home.
Original Mortgage
$114,000
Interest Rate
8.7%
Mortgage Type
Purchase Money Mortgage
Create a Home Valuation Report for This Property
The Home Valuation Report is an in-depth analysis detailing your home's value as well as a comparison with similar homes in the area
Home Values in the Area
Average Home Value in this Area
Purchase History
| Date | Buyer | Sale Price | Title Company |
|---|---|---|---|
| King Neal L | $117,705 | -- | |
| Fleet Mtg Group | $114,750 | -- | |
| Hayward James | $120,000 | -- |
Source: Public Records
Mortgage History
| Date | Status | Borrower | Loan Amount |
|---|---|---|---|
| Open | Hayward James | $117,000 | |
| Closed | Hayward James | $117,229 | |
| Previous Owner | Hayward James | $114,000 |
Source: Public Records
Tax History Compared to Growth
Tax History
| Year | Tax Paid | Tax Assessment Tax Assessment Total Assessment is a certain percentage of the fair market value that is determined by local assessors to be the total taxable value of land and additions on the property. | Land | Improvement |
|---|---|---|---|---|
| 2025 | $6,202 | $541,700 | $259,300 | $282,400 |
| 2024 | $6,033 | $527,800 | $259,300 | $268,500 |
| 2023 | $5,763 | $482,700 | $235,700 | $247,000 |
| 2022 | $5,731 | $439,800 | $196,400 | $243,400 |
| 2021 | $5,457 | $394,300 | $178,500 | $215,800 |
| 2020 | $5,337 | $393,000 | $178,500 | $214,500 |
| 2019 | $5,112 | $371,800 | $170,000 | $201,800 |
| 2018 | $4,904 | $340,300 | $161,900 | $178,400 |
| 2017 | $4,427 | $306,400 | $154,900 | $151,500 |
| 2016 | $4,284 | $292,800 | $147,500 | $145,300 |
| 2015 | $4,120 | $286,700 | $147,500 | $139,200 |
| 2014 | $3,772 | $264,900 | $140,400 | $124,500 |
Source: Public Records
Map
Nearby Homes