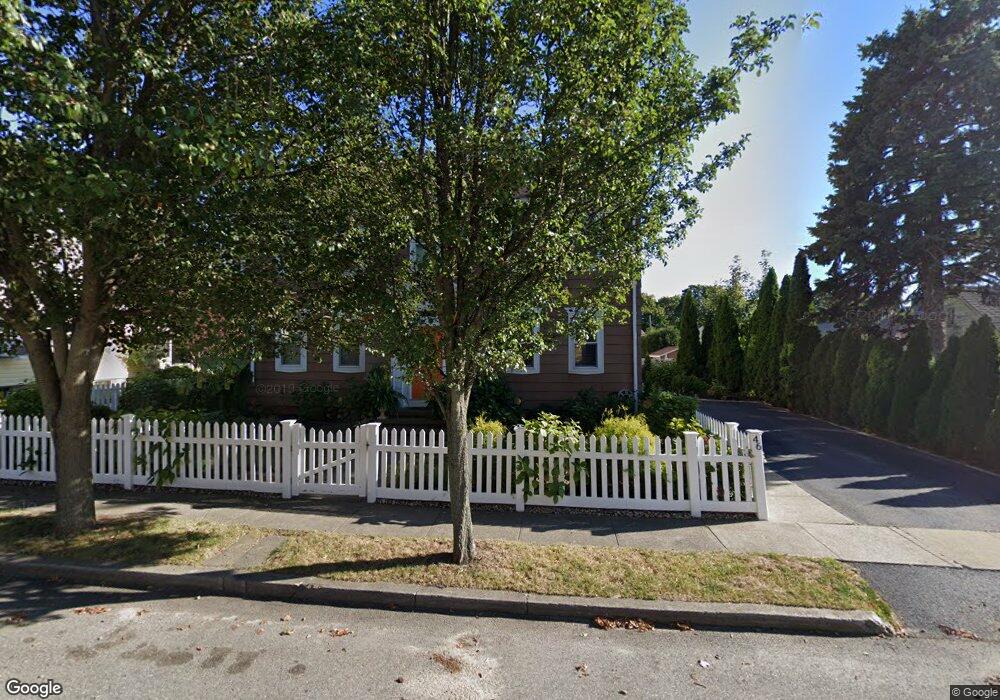
46 Broad St Warren, RI 02885
Downtown Warren NeighborhoodEstimated Value: $552,000 - $891,000
2
Beds
1
Bath
950
Sq Ft
$797/Sq Ft
Est. Value
About This Home
This home is located at 46 Broad St, Warren, RI 02885 and is currently estimated at $757,598, approximately $797 per square foot. 46 Broad St is a home located in Bristol County with nearby schools including Mt. Hope High School, Highlander Charter Middle and High School, and East Bay Career Academy.
Ownership History
Date
Name
Owned For
Owner Type
Purchase Details
Closed on
Jul 1, 1998
Sold by
Buckley Steven G
Bought by
Mercurio Bal A and Mercurio Maria S
Current Estimated Value
Home Financials for this Owner
Home Financials are based on the most recent Mortgage that was taken out on this home.
Original Mortgage
$160,250
Interest Rate
7.04%
Purchase Details
Closed on
Oct 1, 1991
Sold by
Banalewicz Stanley
Bought by
Buckley Steven G
Create a Home Valuation Report for This Property
The Home Valuation Report is an in-depth analysis detailing your home's value as well as a comparison with similar homes in the area
Home Values in the Area
Average Home Value in this Area
Purchase History
| Date | Buyer | Sale Price | Title Company |
|---|---|---|---|
| Mercurio Bal A | $165,000 | -- | |
| Buckley Steven G | $171,000 | -- |
Source: Public Records
Mortgage History
| Date | Status | Borrower | Loan Amount |
|---|---|---|---|
| Open | Buckley Steven G | $50,000 | |
| Open | Buckley Steven G | $221,500 | |
| Closed | Buckley Steven G | $75,000 | |
| Closed | Buckley Steven G | $160,250 |
Source: Public Records
Tax History
| Year | Tax Paid | Tax Assessment Tax Assessment Total Assessment is a certain percentage of the fair market value that is determined by local assessors to be the total taxable value of land and additions on the property. | Land | Improvement |
|---|---|---|---|---|
| 2025 | $8,581 | $576,300 | $193,200 | $383,100 |
| 2024 | $8,322 | $576,300 | $193,200 | $383,100 |
| 2023 | $7,872 | $576,300 | $193,200 | $383,100 |
| 2022 | $7,031 | $390,400 | $122,200 | $268,200 |
| 2021 | $6,918 | $390,400 | $122,200 | $268,200 |
| 2020 | $6,777 | $390,400 | $122,200 | $268,200 |
| 2019 | $6,667 | $348,900 | $98,000 | $250,900 |
| 2018 | $6,580 | $348,900 | $98,000 | $250,900 |
| 2017 | $6,563 | $348,900 | $98,000 | $250,900 |
| 2016 | $6,694 | $335,200 | $79,200 | $256,000 |
| 2015 | $6,694 | $335,200 | $79,200 | $256,000 |
| 2014 | $6,727 | $335,200 | $79,200 | $256,000 |
Source: Public Records
Map
Nearby Homes
- 31 Child St
- 69 Cutler St
- 21 Federal St
- 115 Market St
- 37 Warren Ave
- 74 Adams Point Rd
- 13 Kelly St
- 10 Jesse Davis Ln
- 22 Lantern Ln
- 367 Child St
- 51 Hawthorne Ave
- 388 Child St
- 11 Mathewson Rd
- 39 Bagy Wrinkle Cove
- 596 Metacom Ave
- 35 Bagy Wrinkle Cove
- 2 Bagy Wrinkle Cove
- 9 Lillis Ave
- 0 Lillis Ave
- 4 Read Ave
Your Personal Tour Guide
Ask me questions while you tour the home.