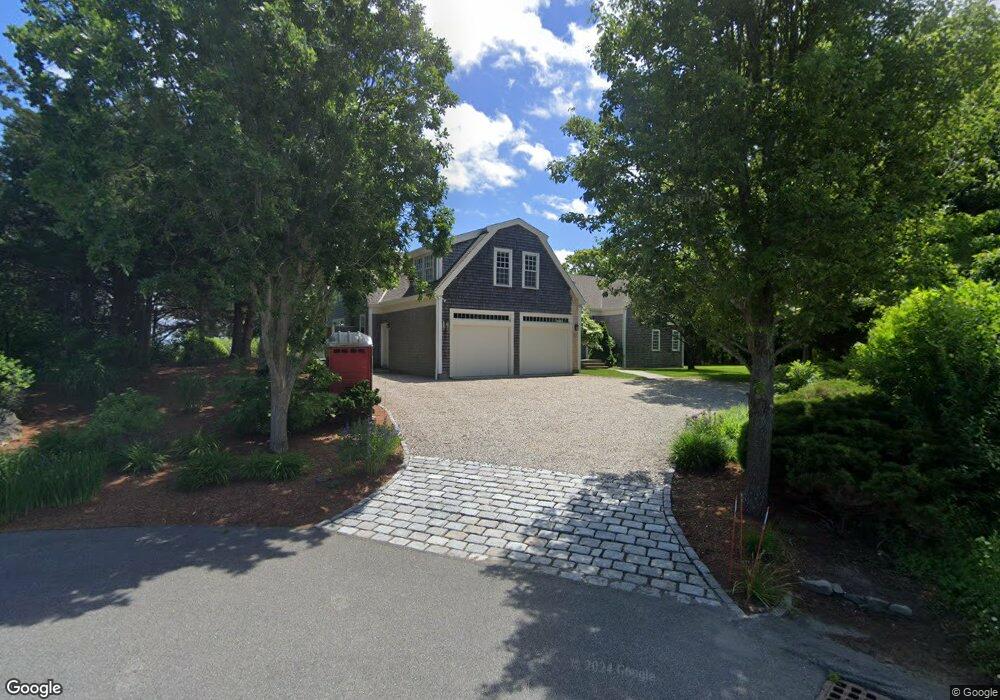
46 Burning Tree Ln West Barnstable, MA 02668
West Barnstable NeighborhoodEstimated Value: $2,165,000 - $3,383,000
5
Beds
5
Baths
4,294
Sq Ft
$642/Sq Ft
Est. Value
About This Home
This home is located at 46 Burning Tree Ln, West Barnstable, MA 02668 and is currently estimated at $2,755,064, approximately $641 per square foot. 46 Burning Tree Ln is a home located in Barnstable County with nearby schools including West Barnstable Elementary School, Barnstable United Elementary School, and Barnstable Intermediate School.
Ownership History
Date
Name
Owned For
Owner Type
Purchase Details
Closed on
Oct 7, 2015
Sold by
Eckert Robert A and Eckert Kathleen
Bought by
Eckert Kathleen M
Current Estimated Value
Purchase Details
Closed on
Jul 8, 2008
Sold by
Richardson Larry W and Richardson Margaret D
Bought by
Eckert Kathleen and Eckert Robert A
Purchase Details
Closed on
May 1, 2007
Sold by
Kassler Hilary and Mamuya Wilfred
Bought by
Richardson Larry W and Richardson Margaret D
Home Financials for this Owner
Home Financials are based on the most recent Mortgage that was taken out on this home.
Original Mortgage
$1,000,000
Interest Rate
6.18%
Mortgage Type
Purchase Money Mortgage
Purchase Details
Closed on
Mar 19, 1999
Sold by
Congdon Carey and Congdon Mary M
Bought by
Kassler Hilary and Mamuya Wilfred
Create a Home Valuation Report for This Property
The Home Valuation Report is an in-depth analysis detailing your home's value as well as a comparison with similar homes in the area
Home Values in the Area
Average Home Value in this Area
Purchase History
| Date | Buyer | Sale Price | Title Company |
|---|---|---|---|
| Eckert Kathleen M | -- | -- | |
| Eckert Kathleen | $1,675,000 | -- | |
| Richardson Larry W | $1,500,000 | -- | |
| Kassler Hilary | $297,000 | -- |
Source: Public Records
Mortgage History
| Date | Status | Borrower | Loan Amount |
|---|---|---|---|
| Previous Owner | Richardson Larry W | $1,000,000 | |
| Previous Owner | Kassler Hilary | $640,000 | |
| Previous Owner | Kassler Hilary | $200,000 | |
| Previous Owner | Kassler Hilary | $898,500 | |
| Previous Owner | Kassler Hilary | $60,000 |
Source: Public Records
Tax History
| Year | Tax Paid | Tax Assessment Tax Assessment Total Assessment is a certain percentage of the fair market value that is determined by local assessors to be the total taxable value of land and additions on the property. | Land | Improvement |
|---|---|---|---|---|
| 2025 | $24,099 | $2,580,200 | $1,270,200 | $1,310,000 |
| 2024 | $20,919 | $2,438,100 | $1,270,200 | $1,167,900 |
| 2023 | $18,446 | $2,024,800 | $1,026,200 | $998,600 |
| 2022 | $19,310 | $1,738,100 | $909,800 | $828,300 |
| 2021 | $19,487 | $1,662,700 | $909,800 | $752,900 |
| 2020 | $20,242 | $1,670,100 | $975,900 | $694,200 |
| 2019 | $20,513 | $1,670,400 | $975,900 | $694,500 |
| 2018 | $19,467 | $1,571,200 | $972,500 | $598,700 |
| 2017 | $18,971 | $1,549,900 | $972,500 | $577,400 |
| 2016 | $18,631 | $1,553,900 | $976,500 | $577,400 |
| 2015 | $17,738 | $1,483,100 | $936,000 | $547,100 |
Source: Public Records
Map
Nearby Homes
- 3 Mulberry Cir
- 20 Howland Ln
- 46 Carleton Dr
- 2 Jillson Way
- 26 Carlson Ln
- 65 Wing Blvd W
- 45 Wayside Ln
- 0 Captain Kidd Rd
- 566 Route 6a
- 6 Harpers Hollow
- 27 White Cap Ln
- 46 Service Rd
- 507 Route 6a Unit 9
- 53 Chase Rd
- 29 Fish House Rd
- 2 Maple Swamp Rd
- 2 Maple Swamp Rd
- 7 Maxwell Ln
- 174 N Shore Blvd Unit 1
- 282 Parker Rd
- 46 Burning Tree Ln
- 25 Burning Tree Ln
- 44 Holway Dr
- 42 Burning Tree Ln
- 28 Holway Dr
- 26 Burning Tree Ln
- 10 Burning Tree Ln
- 52 Point Hill Rd
- 58 Holway Dr
- 22 Burning Tree Ln
- 70 Point Hill Rd
- 0 Holway Dr
- 74 Holway Dr
- 26 Point Hill Rd
- 350 Sandy Neck Rd
- 51 Holway Dr
- 31 Holway Dr
- 352 Sandy Neck Rd
- 356 Sandy Neck Rd
- 354 Sandy Neck Rd
Your Personal Tour Guide
Ask me questions while you tour the home.