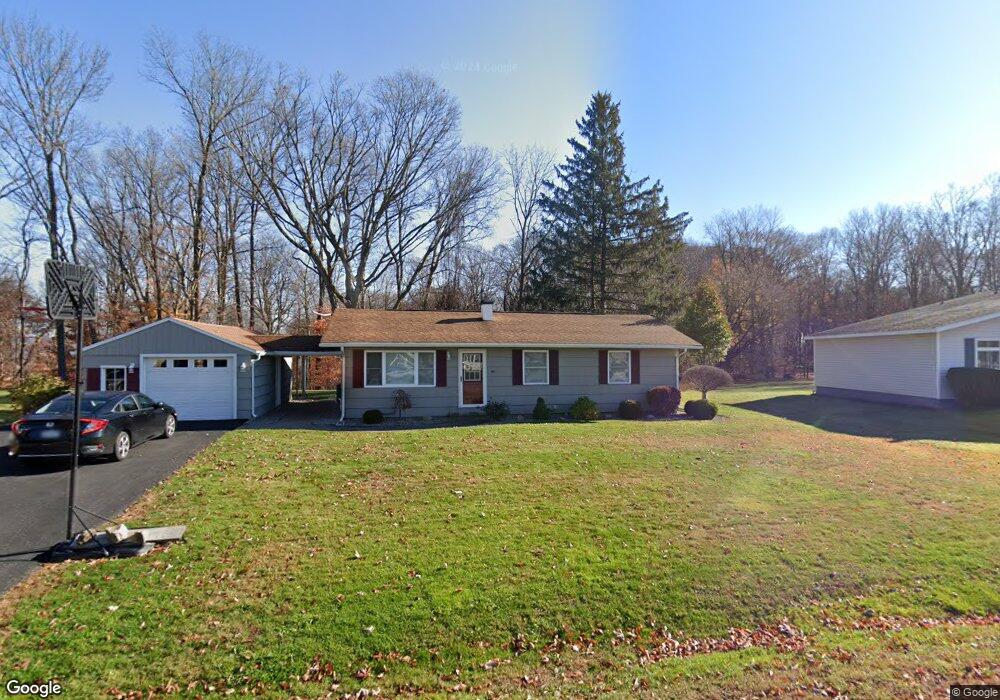
46 Cedarbrook Crescent Whitesboro, NY 13492
Estimated Value: $219,000 - $274,000
3
Beds
2
Baths
9,999,999
Sq Ft
$0/Sq Ft
Est. Value
About This Home
This home is located at 46 Cedarbrook Crescent, Whitesboro, NY 13492 and is currently estimated at $247,282, approximately $0 per square foot. 46 Cedarbrook Crescent is a home located in Oneida County with nearby schools including Whitesboro High School and Harts Hill Baptist Academy.
Ownership History
Date
Name
Owned For
Owner Type
Purchase Details
Closed on
Jun 4, 2018
Sold by
Wagner Michael T and Wagner Gina M
Bought by
Feduccia Stephen J
Current Estimated Value
Home Financials for this Owner
Home Financials are based on the most recent Mortgage that was taken out on this home.
Original Mortgage
$113,600
Outstanding Balance
$98,245
Interest Rate
4.5%
Mortgage Type
Purchase Money Mortgage
Estimated Equity
$149,037
Purchase Details
Closed on
Jun 11, 2010
Sold by
Lestina Beach Wood Real E State Inc
Bought by
Wagner Michael Gina M
Home Financials for this Owner
Home Financials are based on the most recent Mortgage that was taken out on this home.
Original Mortgage
$133,403
Interest Rate
5.11%
Mortgage Type
Purchase Money Mortgage
Purchase Details
Closed on
Jun 25, 2009
Sold by
Oneida County Bd Of Leg
Bought by
Lustina Beach Rd Real Estate
Create a Home Valuation Report for This Property
The Home Valuation Report is an in-depth analysis detailing your home's value as well as a comparison with similar homes in the area
Home Values in the Area
Average Home Value in this Area
Purchase History
| Date | Buyer | Sale Price | Title Company |
|---|---|---|---|
| Feduccia Stephen J | $142,000 | -- | |
| Wagner Michael Gina M | $135,200 | Jeffrey M Reale | |
| Lustina Beach Rd Real Estate | $47,000 | -- |
Source: Public Records
Mortgage History
| Date | Status | Borrower | Loan Amount |
|---|---|---|---|
| Open | Feduccia Stephen J | $113,600 | |
| Previous Owner | Wagner Michael Gina M | $133,403 |
Source: Public Records
Tax History Compared to Growth
Tax History
| Year | Tax Paid | Tax Assessment Tax Assessment Total Assessment is a certain percentage of the fair market value that is determined by local assessors to be the total taxable value of land and additions on the property. | Land | Improvement |
|---|---|---|---|---|
| 2024 | $1,224 | $72,000 | $20,700 | $51,300 |
| 2023 | $3,837 | $72,000 | $20,700 | $51,300 |
| 2022 | $3,847 | $72,000 | $20,700 | $51,300 |
| 2021 | $3,817 | $72,000 | $20,700 | $51,300 |
| 2020 | $3,808 | $72,000 | $20,700 | $51,300 |
| 2019 | $2,509 | $72,000 | $20,700 | $51,300 |
| 2018 | $2,602 | $72,000 | $20,700 | $51,300 |
| 2017 | $2,509 | $72,000 | $20,700 | $51,300 |
| 2016 | $2,440 | $72,000 | $20,700 | $51,300 |
| 2015 | -- | $72,000 | $20,700 | $51,300 |
| 2014 | -- | $72,000 | $20,700 | $51,300 |
Source: Public Records
Map
Nearby Homes
- 26 Poplar Ave
- 10 Sprucedale Ave
- 17 Gilbert Rd
- 114 Harts Hill Terrace
- 5 Harts Hill Pkwy
- 33 White St
- 59 Bedford Dr
- 37 Cambridge Rd
- 7 Symphony Place
- 418 Main St
- 17 Wagner Ave
- 243 Main St
- 61 West St
- 18 Maple St
- 26 Chestnut St
- 0 Henderson St Unit S1596876
- 0 Cauldwell Ave
- 13 W Kernan Ave
- 00 Deacon Rd
- 6 Gardner St
- 44 Cedarbrook Crescent
- 48 Cedarbrook Crescent
- 37 Cedarbrook Crescent
- 35 Cedarbrook Crescent
- 42 Cedarbrook Crescent
- 50 Cedarbrook Crescent
- 33 Cedarbrook Crescent
- 39 Cedarbrook Crescent
- 40 Cedarbrook Crescent
- 52 Cedarbrook Crescent
- 27 Poplar Ave
- 41 Cedarbrook Crescent
- 31 Cedarbrook Crescent
- 36 Cedarbrook Crescent
- 25 Poplar Ave
- 54 Cedarbrook Crescent
- 43 Cedarbrook Crescent
- 23 Poplar Ave
- 34 Cedarbrook Crescent
- 56 Cedarbrook Crescent