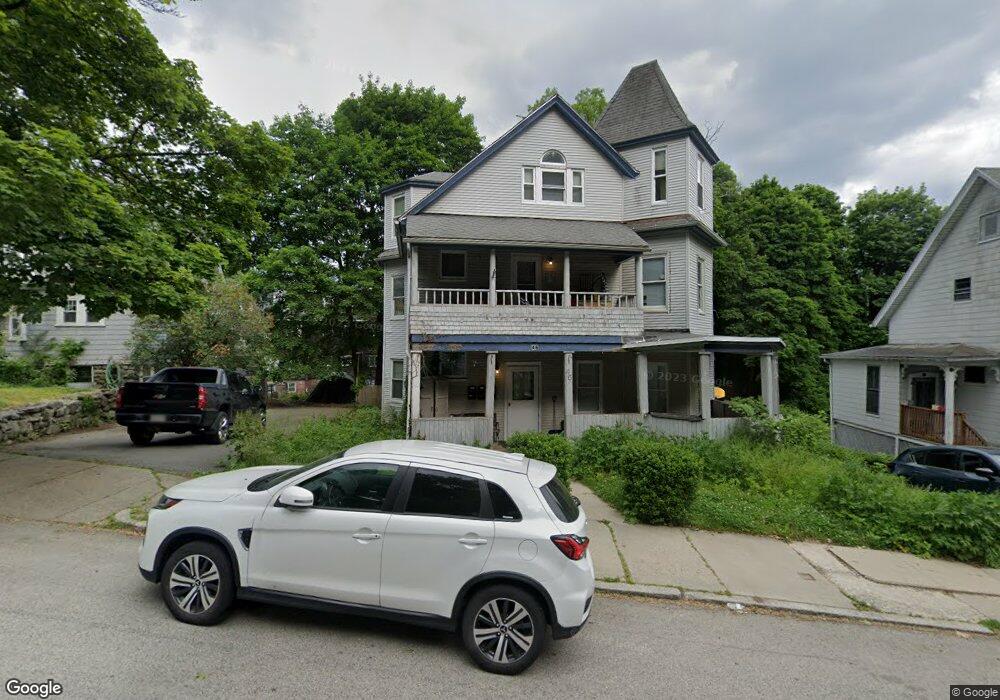
46 Channing St Worcester, MA 01605
Bell Hill NeighborhoodEstimated Value: $676,000 - $735,000
8
Beds
3
Baths
2,990
Sq Ft
$235/Sq Ft
Est. Value
About This Home
This home is located at 46 Channing St, Worcester, MA 01605 and is currently estimated at $703,333, approximately $235 per square foot. 46 Channing St is a home located in Worcester County with nearby schools including Jacob Hiatt Magnet School, Chandler Magnet, and Worcester East Middle School.
Ownership History
Date
Name
Owned For
Owner Type
Purchase Details
Closed on
Nov 27, 2002
Sold by
Filippone Robert J
Bought by
Palumbo Gina L
Current Estimated Value
Home Financials for this Owner
Home Financials are based on the most recent Mortgage that was taken out on this home.
Original Mortgage
$74,411
Outstanding Balance
$31,779
Interest Rate
6.16%
Mortgage Type
Purchase Money Mortgage
Estimated Equity
$671,554
Create a Home Valuation Report for This Property
The Home Valuation Report is an in-depth analysis detailing your home's value as well as a comparison with similar homes in the area
Home Values in the Area
Average Home Value in this Area
Purchase History
| Date | Buyer | Sale Price | Title Company |
|---|---|---|---|
| Palumbo Gina L | $76,000 | -- |
Source: Public Records
Mortgage History
| Date | Status | Borrower | Loan Amount |
|---|---|---|---|
| Open | Palumbo Gina L | $74,411 | |
| Previous Owner | Palumbo Gina L | $30,000 |
Source: Public Records
Tax History
| Year | Tax Paid | Tax Assessment Tax Assessment Total Assessment is a certain percentage of the fair market value that is determined by local assessors to be the total taxable value of land and additions on the property. | Land | Improvement |
|---|---|---|---|---|
| 2025 | $6,861 | $520,200 | $95,200 | $425,000 |
| 2024 | $6,696 | $487,000 | $95,200 | $391,800 |
| 2023 | $6,195 | $432,000 | $82,800 | $349,200 |
| 2022 | $5,562 | $365,700 | $66,200 | $299,500 |
| 2021 | $4,773 | $293,200 | $53,000 | $240,200 |
| 2020 | $4,478 | $263,400 | $52,600 | $210,800 |
| 2019 | $4,621 | $256,700 | $45,900 | $210,800 |
| 2018 | $4,690 | $248,000 | $45,900 | $202,100 |
| 2017 | $4,442 | $231,100 | $45,900 | $185,200 |
| 2016 | $4,314 | $209,300 | $32,800 | $176,500 |
| 2015 | $4,201 | $209,300 | $32,800 | $176,500 |
| 2014 | $4,090 | $209,300 | $32,800 | $176,500 |
Source: Public Records
Map
Nearby Homes
- 6 Mount Vernon St Unit D
- 26 Orne St
- 41 Westminster St
- 139 Lincoln St
- 78 Green Hill Pkwy
- 95 Green Hill Pkwy
- Lot 2 Ararat
- 176 Lincoln St Unit 4
- 15 Breck St
- 145 Eastern Ave
- 91 Stanton St
- 26 Vinson St
- 21 Kendall St
- 249 Lincoln St
- 33 Denmark St
- 15 Edward St
- 27 Harlow St
- 51 Uxbridge St
- 256 Belmont St
- 47 Laurel St
- 46 Channing St Unit 1
- 48 Channing St
- 44 Channing St
- 4 Hermitage Ln
- 45 Channing St
- 42 Channing St
- 47 Channing St
- 4A Hermitage Ln
- 49 Channing St
- 40 Channing St
- 20 Windsor St
- 22 Windsor St
- 22/1-2 Windsor St Unit 1-2
- 6 Hermitage Ln
- 18 Windsor St Unit 7
- 18 Windsor St Unit 6
- 18 Windsor St Unit 5
- 18 Windsor St Unit 4
- 18 Windsor St Unit 3
- 18 Windsor St Unit 2
Your Personal Tour Guide
Ask me questions while you tour the home.