Estimated Value: $570,000 - $665,570
3
Beds
2
Baths
2,776
Sq Ft
$224/Sq Ft
Est. Value
About This Home
This home is located at 46 Chestnut Ridge Dr, Inman, SC 29349 and is currently estimated at $622,643, approximately $224 per square foot. 46 Chestnut Ridge Dr is a home located in Spartanburg County with nearby schools including James H. Hendrix Elementary School, Boiling Springs Middle School, and Boiling Springs High School.
Ownership History
Date
Name
Owned For
Owner Type
Purchase Details
Closed on
Oct 9, 2020
Sold by
Owens Thomas D and Owens Kimberly S
Bought by
Reinheimer Clifford W and Reinheimer Linda
Current Estimated Value
Home Financials for this Owner
Home Financials are based on the most recent Mortgage that was taken out on this home.
Original Mortgage
$408,000
Outstanding Balance
$362,233
Interest Rate
2.8%
Estimated Equity
$260,410
Purchase Details
Closed on
Mar 7, 2006
Sold by
Owens Kimberly S and Corn Kimberly S
Bought by
Owens Thomas D
Purchase Details
Closed on
Oct 15, 2003
Sold by
Holcomb Richard and Holcomb Veronica J
Bought by
Corn Kimberly S
Purchase Details
Closed on
Oct 16, 1990
Sold by
Taylor Derek L
Bought by
Holcomb Richard
Purchase Details
Closed on
Aug 12, 1988
Sold by
Turner Charles F
Bought by
Taylor Derek L
Create a Home Valuation Report for This Property
The Home Valuation Report is an in-depth analysis detailing your home's value as well as a comparison with similar homes in the area
Home Values in the Area
Average Home Value in this Area
Purchase History
| Date | Buyer | Sale Price | Title Company |
|---|---|---|---|
| Reinheimer Clifford W | $525,000 | None Available | |
| Owens Thomas D | -- | None Available | |
| Corn Kimberly S | $27,000 | -- | |
| Holcomb Richard | $23,000 | -- | |
| Taylor Derek L | $21,000 | -- |
Source: Public Records
Mortgage History
| Date | Status | Borrower | Loan Amount |
|---|---|---|---|
| Open | Reinheimer Clifford W | $408,000 |
Source: Public Records
Tax History Compared to Growth
Tax History
| Year | Tax Paid | Tax Assessment Tax Assessment Total Assessment is a certain percentage of the fair market value that is determined by local assessors to be the total taxable value of land and additions on the property. | Land | Improvement |
|---|---|---|---|---|
| 2025 | $11,543 | $31,494 | $6,756 | $24,738 |
| 2024 | $11,543 | $31,494 | $6,756 | $24,738 |
| 2023 | $11,543 | $31,494 | $6,756 | $24,738 |
| 2022 | $12,069 | $31,500 | $4,536 | $26,964 |
| 2021 | $12,069 | $31,500 | $4,536 | $26,964 |
| 2020 | $1,906 | $12,528 | $3,024 | $9,504 |
| 2019 | $1,906 | $12,528 | $3,024 | $9,504 |
| 2018 | $1,864 | $12,528 | $3,024 | $9,504 |
| 2017 | $1,962 | $11,024 | $3,024 | $8,000 |
| 2016 | $1,962 | $11,024 | $3,024 | $8,000 |
| 2015 | $1,942 | $11,024 | $3,024 | $8,000 |
| 2014 | $1,937 | $11,024 | $3,024 | $8,000 |
Source: Public Records
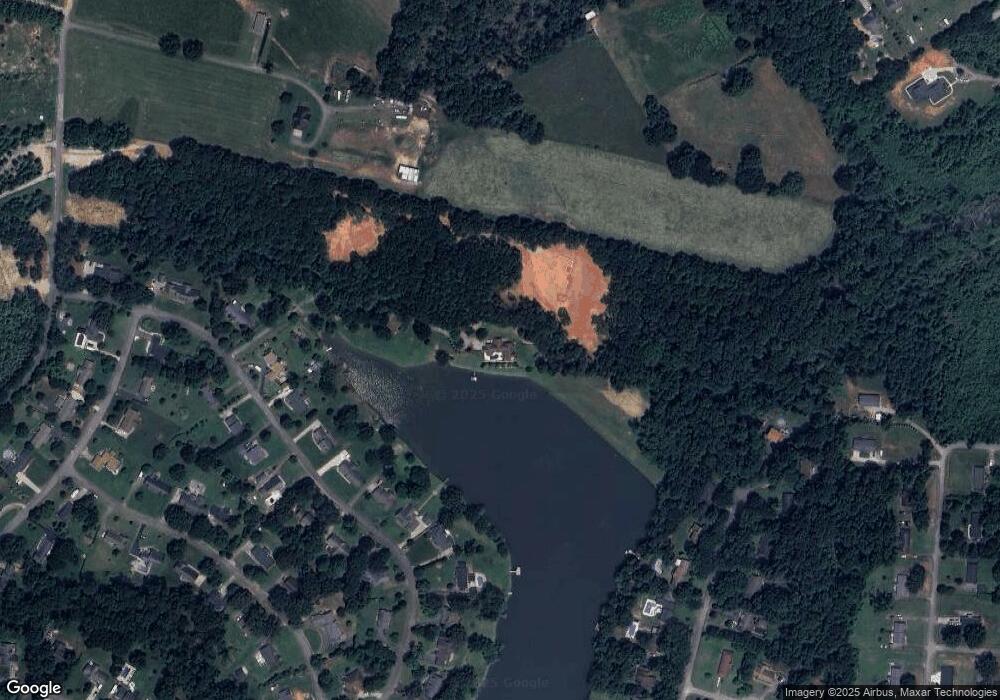
Map
Nearby Homes
- 164 Chestnut Lake Dr
- 312 Sloping Meadow Dr
- 204 Lenderman Dr
- 22 Ashley Ct
- 1003 Settle Rd
- 0 New Cut Rd Unit SPN329370
- 0 New Cut Rd Unit 1533597
- 0 New Cut Rd Unit 314056
- 152 Schrimsher Dr
- The Summerton Plan at Westbriar Woods - Single Family Homes
- The Cade Plan at Westbriar Woods - Single Family Homes
- The Granger Plan at Westbriar Woods - Single Family Homes
- 537 Harvest Valley Ct
- 520 Harvest Valley Ct
- 1636 Savannah Mills Dr
- 1628 Savannah Mills Dr
- 1632 Savannah Mills Dr
- 1624 Savannah Mills Dr
- 1620 Savannah Mills Dr
- 1621 Savannah Mills Dr
- 36 Chestnut Ridge Dr
- 34 Chestnut Ridge Dr
- 38 Chestnut Ridge Dr
- 32 Chestnut Ridge Dr
- 40 Chestnut Ridge Dr
- 42 Chestnut Ridge Dr
- 44 Chestnut Ridge Dr
- 30 Chestnut Ridge Dr
- 25 Chestnut Ridge Dr
- 48 Chestnut Ridge Dr
- 27 Chestnut Ridge Dr
- 23 Chestnut Ridge Dr
- 29 Chestnut Ridge Dr
- 165 Chestnut Lake Dr
- 28 Chestnut Ridge Dr
- 31 Chestnut Ridge Dr
- 166 Chestnut Lake Dr
- 33 Chestnut Ridge Dr
- 163 Chestnut Lake Dr
- 35 Chestnut Ridge Dr