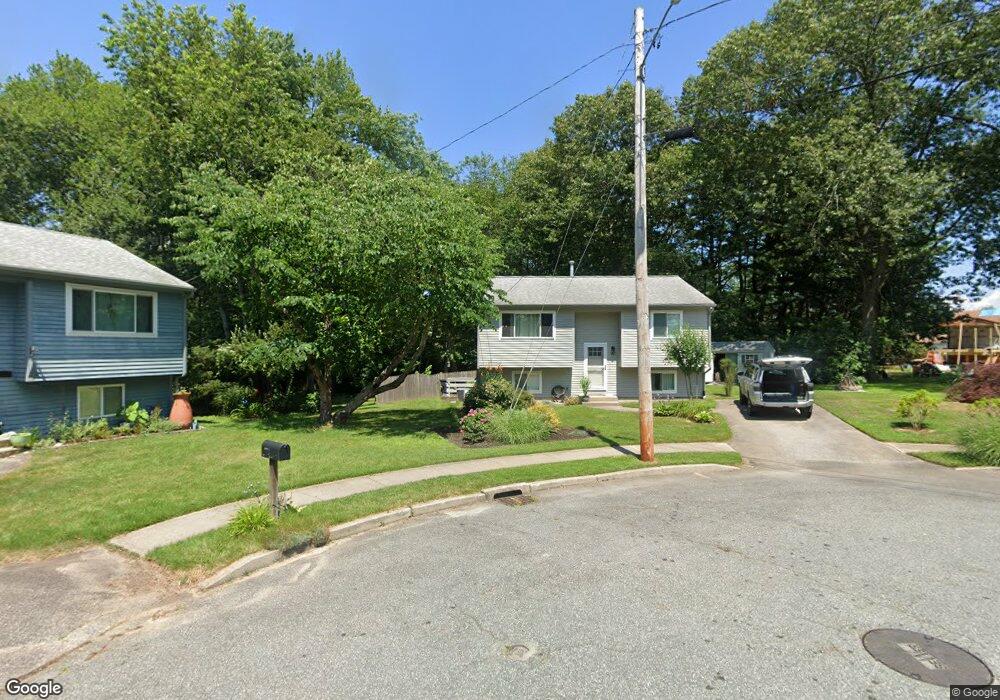
46 Felicia Ct Warwick, RI 02889
Oakland Beach NeighborhoodEstimated Value: $325,000 - $394,000
2
Beds
1
Bath
846
Sq Ft
$441/Sq Ft
Est. Value
About This Home
This home is located at 46 Felicia Ct, Warwick, RI 02889 and is currently estimated at $373,232, approximately $441 per square foot. 46 Felicia Ct is a home located in Kent County with nearby schools including Saint Kevin School and Bishop Hendricken High School.
Ownership History
Date
Name
Owned For
Owner Type
Purchase Details
Closed on
May 8, 1992
Sold by
Centerville Bldrs Inc
Bought by
Schroder Alan M
Current Estimated Value
Home Financials for this Owner
Home Financials are based on the most recent Mortgage that was taken out on this home.
Original Mortgage
$89,900
Interest Rate
8.91%
Mortgage Type
Purchase Money Mortgage
Create a Home Valuation Report for This Property
The Home Valuation Report is an in-depth analysis detailing your home's value as well as a comparison with similar homes in the area
Home Values in the Area
Average Home Value in this Area
Purchase History
| Date | Buyer | Sale Price | Title Company |
|---|---|---|---|
| Schroder Alan M | $100,000 | -- | |
| Schroder Alan M | $100,000 | -- |
Source: Public Records
Mortgage History
| Date | Status | Borrower | Loan Amount |
|---|---|---|---|
| Open | Schroder Alan M | $25,000 | |
| Open | Schroder Alan M | $94,000 | |
| Closed | Schroder Alan M | $94,050 | |
| Closed | Schroder Alan M | $89,900 |
Source: Public Records
Tax History Compared to Growth
Tax History
| Year | Tax Paid | Tax Assessment Tax Assessment Total Assessment is a certain percentage of the fair market value that is determined by local assessors to be the total taxable value of land and additions on the property. | Land | Improvement |
|---|---|---|---|---|
| 2025 | $4,948 | $389,600 | $162,900 | $226,700 |
| 2024 | $4,376 | $302,400 | $116,400 | $186,000 |
| 2023 | $4,291 | $302,400 | $116,400 | $186,000 |
| 2022 | $3,980 | $212,500 | $70,800 | $141,700 |
| 2021 | $3,980 | $212,500 | $70,800 | $141,700 |
| 2020 | $3,980 | $212,500 | $70,800 | $141,700 |
| 2019 | $3,980 | $212,500 | $70,800 | $141,700 |
| 2018 | $3,567 | $171,500 | $73,700 | $97,800 |
| 2017 | $3,471 | $171,500 | $73,700 | $97,800 |
| 2016 | $3,471 | $171,500 | $73,700 | $97,800 |
| 2015 | $3,202 | $154,300 | $69,400 | $84,900 |
| 2014 | $3,095 | $154,300 | $69,400 | $84,900 |
| 2013 | $3,054 | $154,300 | $69,400 | $84,900 |
Source: Public Records
Map
Nearby Homes
- 46 Verndale St
- 86 Glen Dr
- 352 Church Ave
- 700 Sandy Ln Unit 6
- 700 Sandy Ln Unit 17
- 700 Sandy Ln Unit 18
- 700 Sandy Ln Unit 1
- 355 Church Ave
- 78 Jennie Ln
- 150 Church Ave
- 176 Vernon St
- 136 Sefton Ave
- 81 Yucatan Dr
- 985 Cedar Swamp Rd
- 139 Yucatan Dr
- 39 Damon Ave
- 62 Ardway Ave
- 15 Obadiah Ave
- 69 Steele Ave
- 1851 W Shore Rd