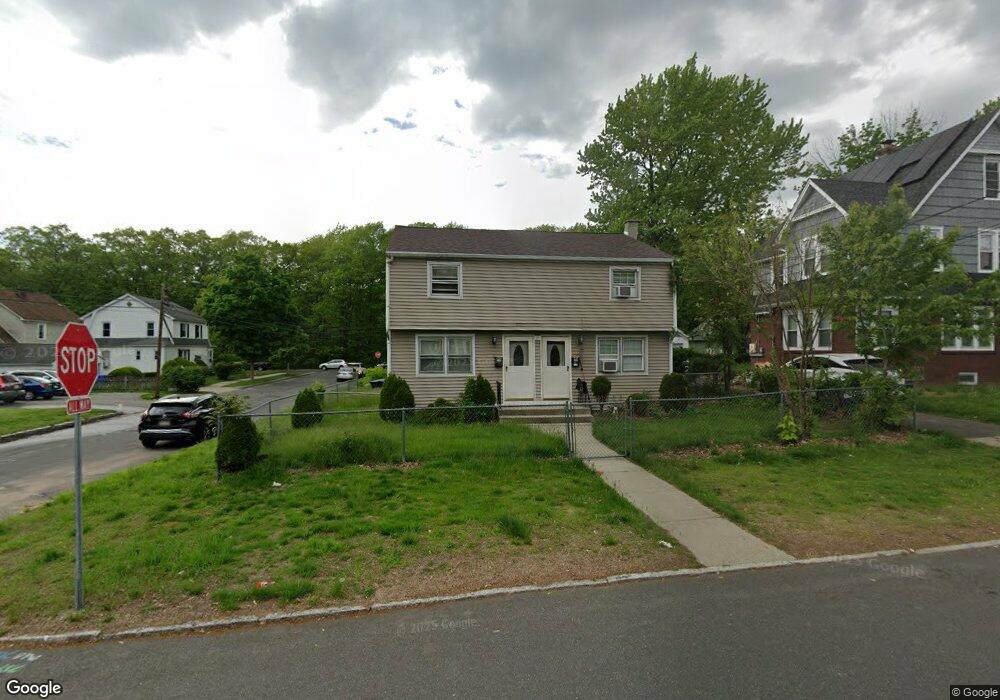
46 Fenwick St Unit 48 Springfield, MA 01109
Upper Hill NeighborhoodEstimated Value: $253,000 - $422,000
4
Beds
2
Baths
1,710
Sq Ft
$190/Sq Ft
Est. Value
About This Home
This home is located at 46 Fenwick St Unit 48, Springfield, MA 01109 and is currently estimated at $324,048, approximately $189 per square foot. 46 Fenwick St Unit 48 is a home located in Hampden County with nearby schools including Homer Street Elementary School, John J Duggan Middle, and Springfield High School of Science and Technology.
Ownership History
Date
Name
Owned For
Owner Type
Purchase Details
Closed on
Apr 28, 2010
Sold by
Dibenedetto Filomena
Bought by
Dibenedetto Filomena and Dibenedetto Martino
Current Estimated Value
Purchase Details
Closed on
Oct 30, 1996
Sold by
Tamesar Kuwarlall and Tamesar Glenrose C
Bought by
Duong Lam T
Home Financials for this Owner
Home Financials are based on the most recent Mortgage that was taken out on this home.
Original Mortgage
$38,000
Interest Rate
8.07%
Mortgage Type
Purchase Money Mortgage
Purchase Details
Closed on
Mar 12, 1990
Sold by
Cogswell David W
Bought by
Tamesar Kuwarlall
Home Financials for this Owner
Home Financials are based on the most recent Mortgage that was taken out on this home.
Original Mortgage
$70,000
Interest Rate
9.95%
Mortgage Type
Purchase Money Mortgage
Create a Home Valuation Report for This Property
The Home Valuation Report is an in-depth analysis detailing your home's value as well as a comparison with similar homes in the area
Home Values in the Area
Average Home Value in this Area
Purchase History
| Date | Buyer | Sale Price | Title Company |
|---|---|---|---|
| Dibenedetto Filomena | -- | -- | |
| Dibenedetto Filomena | $88,000 | -- | |
| Duong Lam T | $53,000 | -- | |
| Tamesar Kuwarlall | $100,000 | -- |
Source: Public Records
Mortgage History
| Date | Status | Borrower | Loan Amount |
|---|---|---|---|
| Previous Owner | Tamesar Kuwarlall | $38,000 | |
| Previous Owner | Tamesar Kuwarlall | $70,000 | |
| Previous Owner | Tamesar Kuwarlall | $72,000 |
Source: Public Records
Tax History
| Year | Tax Paid | Tax Assessment Tax Assessment Total Assessment is a certain percentage of the fair market value that is determined by local assessors to be the total taxable value of land and additions on the property. | Land | Improvement |
|---|---|---|---|---|
| 2025 | $4,309 | $274,800 | $39,000 | $235,800 |
| 2024 | $3,920 | $244,100 | $32,500 | $211,600 |
| 2023 | $3,748 | $219,800 | $29,500 | $190,300 |
| 2022 | $3,544 | $188,300 | $27,600 | $160,700 |
| 2021 | $3,404 | $180,100 | $25,100 | $155,000 |
| 2020 | $3,213 | $164,500 | $25,100 | $139,400 |
| 2019 | $2,968 | $150,800 | $25,100 | $125,700 |
| 2018 | $2,945 | $145,600 | $25,100 | $120,500 |
| 2017 | $2,945 | $149,800 | $23,200 | $126,600 |
| 2016 | $2,664 | $135,500 | $23,200 | $112,300 |
| 2015 | $2,203 | $112,000 | $14,500 | $97,500 |
Source: Public Records
Map
Nearby Homes
- 87 Fenwick St
- 11 Ina St
- 111 Marlborough St
- 89 Bristol St
- 62-64 Bristol St
- 135-137 Suffolk St
- 31-33 Suffolk St
- 283 Wilbraham Rd
- 48-50 Dresden St
- 25 Dresden St
- 124-126 Westford Cir
- 236 Pondview Dr
- 0 NS (24) Alden St
- 21 Westford Cir
- 19 Westford Ave
- 22 Amanda St
- 44 Amanda St
- 189 Northampton Ave
- 54 S Shore Dr
- 46 Mapledell St
- 42 Fenwick St
- 981 Roosevelt Ave
- 38 Fenwick St
- 5 Crest St
- 985 Roosevelt Ave
- 45 Fenwick St
- 969 Roosevelt Ave
- 989 Roosevelt Ave
- 45 - 47 Fenwick St
- 41 Fenwick St Unit 43
- 41 Fenwick St Unit 2
- 41-43 Fenwick St
- 47 Fenwick St
- 32 Fenwick St
- 965 Roosevelt Ave
- 66 Fenwick St Unit 68
- 66-68 Fenwick St
- 35 Fenwick St Unit 37
- 57 Fenwick St Unit 59
- 997 Roosevelt Ave
Your Personal Tour Guide
Ask me questions while you tour the home.